You must have read our last post. In our last post we discussed how you can easily make 1000 pips per month with low risk. In this post we are going to further elaborate on what we told you in the last post. As explained in the last post, our strategy focuses on making 200 pips per trade with a small stop loss of 20 pips. This gives us a reward to risk ratio of 10:1 which is excellent. What we want is a set and forget sort of a trading strategy. This means that our trade will always have a stop loss of 20 pips and a take profit target of 200 pips. When we have opened a trade there can be only two outcomes either the stop loss will get hit or the take profit target will get hit. In this post we are going to discuss in detail how we are going to develop a trading system that exactly implements our trading strategy as described above.
Trading Is A Game Of Probabilities
Before we continue further you should keep this in mind that trading is a game of probabilities. When we talk of probabilities we are talking of each trade as an event like the toss of a coin. Let’s toss a coin. It can be either Head or Tail just like Win or Lose for our trade. Suppose the probability of head (H) or the tail (T) is the same. It is 1/2 or 50%. On each toss of the coin, the probability of head is 50% and the probability of tail is 50%. It can just happen like this that in a series of 10 tosses, we get TTTHHTTHTT. So we have total of 7 tails and 3 heads in 1o tosses. We cannot predict an individual event but in a large tossing of the coin something like 5000 tosses, we can predict with a high degree of accuracy how many times the head will come and how many times the tail will come. This should be close to 0.5. This is known as the LAW OF LARGE NUMBERS.
When we are trading we are also dealing with the LAW OF LARGE NUMBERS. We can lose single trades but what matters is how many trades we won in the long run. In the long run we need to be profitable meaning we should be winning more than losing. If we can do that we can make a consistent income as a trader. Let’s say we make 10 trades. Suppose we are only able to win 50% of the trades. What this means? It means in a series of 10 trades on average you will win 5 trades and you will lose 5 trades. Our stop loss is always 20 pips, on average we will always lose 20 pips. Since our take profit target is 200 pips always, we will on average win 200 pips. So winning 5 trades and making 200 pips means we make 1000 pips and losing 5 trades with 20 pips stop loss means we lose 100 pips. So we make 900 pips net.
If you had read our last post we explained to you why it is much easier to trade on H4 timeframe as compared to H1 or M30 timeframe. Candlestick signals that we get on H4 timeframe are much more reliable as compared to the candlestick signals that we get on M30 or H1 timeframe. First we let the trend develop. Once we have the trend and we know the direction of the trend then we look for a low risk entry. We do not try to catch the top or the bottom. Trying to catch the top or the bottom is an exercise in futility. As said above we focus on reducing the risk to the minimum while at the same time we try to maximize our profit. We have seen even with a winrate of just 50% we make 900 pips while lose only 100 pips. But we aim for a winrate of 80% not 50%. If we can achieve a winrate of 80% it means we only lose 40 pips in 10 trades and make 1600 pips so we make net 1560 pips. This is how it goes. As we have said above once the trade gets opened there can be only 2 outcomes either the stop loss gets hit or the take profit target gets hit. After opening the trade we can go and do whatever we want. We don’t need to monitor the chart. The trade will take its course.
AUDUSD Live Trade Example
We trade these pairs EURUSD, GBPUSD, NZDUSD, AUDUSD, USDJPY, USDCAD, USDCHF, GBPNZD, GBPJPY, EURJPY, EURNZD, XAUUSD and Oil. We can add more pairs also. However we prefer to only trade EURUSD, GBPUSD, NZDUSD, AUDUSD, USDJPY, USDCAD and USDCHF as the spread is 1 pip for these pairs with our broker. Since we want have 10 trades in 1 week. We can add more pairs like AUDJPY, NZDJPY, GBPCHF, GBPCAD etc if we want so that we achieve our target of 10 trades per week.
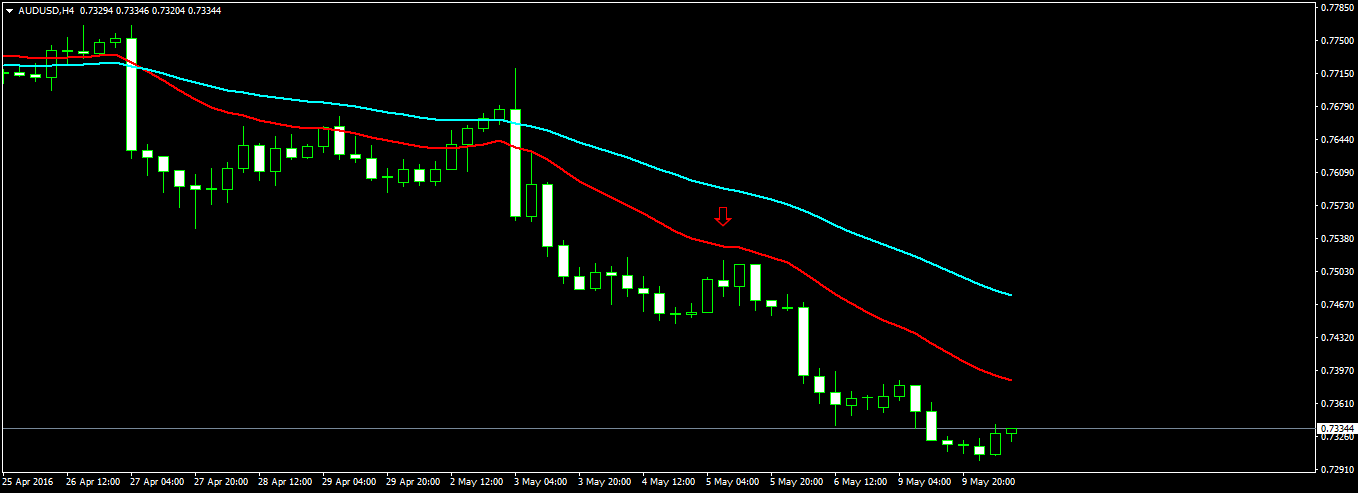
As you can see this is the screenshot of H4 timeframe AUDUSD pair. Just below the red arrow in the screenshot above we can see a bearish candle which is our signal of a downward move that can potentially result in a 200 pip movement. We place a pending sell limit order with entry price of 0.75060 and the stop loss of 0.75200. Our risk is 14 pips. Take profit target is 0.73200. We place the pending sell limit order and then close the computer. As said above our trading strategy should be easy to trade and it should not require us to monitor the charts all the time. We only need to look at the chart at the close of the H4 candle and check whether we have a signal or not. When we open a trade we do not open another trader as long as the first trade doesn’t get breakeven so that the risk always stays below 2% for our account. The trade gets triggered. The take profit target is hit after 3 days.
Always Use Pending Orders
As you can see above we looked at the H4 candle and realized that we have a sell signal. We knew that price is going to make a retracement and retest the high made by the signal H4 candle. So we placed a pending sell limit order just 8 pips below the high and placed our stop loss 6 pips above the high. So our total risk was only 14 pips. Always use the pending order. Pending orders can give you low risk entries and you don’t need to watch the chart all the time. As said above we always try to keep the risk below 20 pips. In this case the risk was only 14 pips. Risk is the most important thing. If you learn to keep the risk low, you will never suffer a catastrophic loss. For us risk is the most important thing.
Using Deep Learning Neural Networks To Predict The Next 3 Daily Candles
You might have wondered how did we know that price is going to drop down 200 pips in the next 3 days.
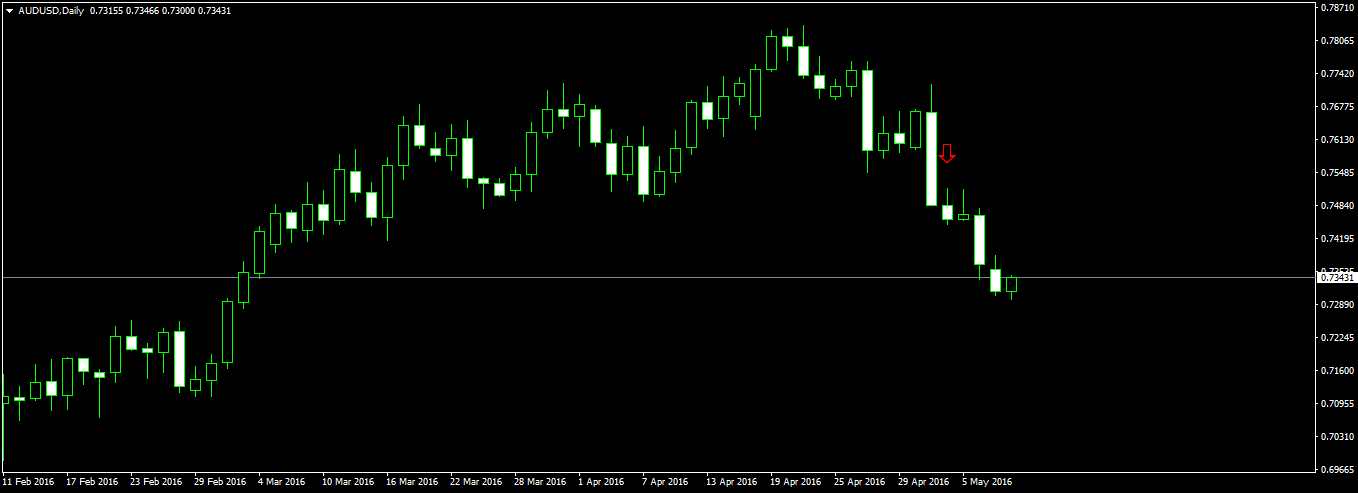
You can see this is the screenshot of AUDUSD daily timeframe. The red arrow show the entry signal on the daily chart. As said above we placed the pending sell limit order. Looking at the above daily candle we know price is going to go down. But how much? We cannot tell that by just looking at the candlesticks. For that we have developed a deep learning neural network using the latest machine learning algorithm. Daily we use that deep learning neural network to make prediction on how the next 3 daily candles. We also have developed a deep learning neural network for making predictions on the weekly timeframe. We cannot tell you much as this is proprietary information and we cannot disclose the design of our neural network. Suffice to say that that neural network can make pretty good predictions.
We combine the predictions made by the neural network with candlestick analysis. The neural network gives us the high and low of the daily candle. So we know this is the level where the market is going to make the high for the day and this is the level where the market is going to make the low for the day. We watch that level by just placing a sound alert on MT4 that tell us that price is in the vicinity of the level that we want to watch. The shape of the daily candles tell us the direction in which market is going to move in the next 1-3 days. So the neural network tells us that today we should only enter into a sell trade. This is the high that we should watch. As said above we place a sound alert on MT4. When price moves near that high level we watch the H4 candle. If H4 candle finds resistance near that level we know then that this predicted level will be respected by the market. Accordingly we place a pending order as said above based on candlestick analysis. If you want you can try our signals for 15 days and see how accurate our trades are.