It is simply impossible to predict price. We can just look for price patterns that worked in the past and hope that they continue to work in the future. Sometimes the price patterns work and sometimes they don’t work. We need a method that minimizes our losses and let our profit run. This means we need to use a small stop loss something like 10 pips and try to catch a big 50-100 pip move using a few patterns that we have found to predict 50-100 pip movement in the past. Forex trading is a scientific, technological and an engineering challenge. I learned Python, R, C# and have delved into algorithmic trading. I have coded EAs in MQL4/MQL5. To tell you the truth: There is no trading system that is 100% accurate.
This is what I discovered. Forex trading is a mental game just like any video game. The more you practice, the more expert you become. The first thing you need to learn when trading forex is how to control your emotions. Your emotions are your biggest enemy. Your mind will constantly try to wreck your trading plan. If you can control your mind, you can control the market. How do we control our emotions? We need strict risk and money management rules. As a valued subscriber to my Ultimate Swing Trading Newsletter, I will show you how to control your emotions and become an emotionless robot when trading forex.
There is a lot of hype now a days about algorithmic trading. You will be told algorithmic trading systems now rule the market. As a retail trader, you cannot beat the algorithms. This is true. Today algorithms rule the market. Big banks and hedge funds are the masters of algorithmic trading. They have Quants. Who are Quants? Quants are very smart people having PhDs in Maths and Quantitative Finance from ivy league universities. There job is to develop algorithmic trading systems that can constantly monitor the market and wreck havoc as much as possible. Quants have developed sophisticated algorithms that dissect price tick by tick. Market moves very fast now a days. When these algorithms spot an opportunity, they swiftly enter the market, make the killing and exit. It is so fast that I have seen price jumping 100-200 pips in just a few seconds.
Know these broker games
Trading is a zero sum game. If you win, someone else has to lose and if you are losing, someone else is winning, mostly probably your broker. This is what the brokers do. When you open an account. They classify you as a novice trader or an expert trader by looking at your trading performance. If you are classified as a novice trader, your broker will always open a position exactly opposite to your position knowing that you will lose 99% of the time. So when you go long, your broker will go short. You lose, your broker wins. Now this is interesting. If you are classified as an expert trader, your broker will always open a trade in the same direction as yours trying to piggy back on your skill level. So if you go long, the broker will also go long. Sounds interesting? After all brokers are also in the market just like you and want to make money and profit while at the same time hedging their risk.
Develop a trading plan
This is what I have learned in the last 10 years as a forex trader. You as a retail trader still has the edge and can win the game. You just need to focus on risk management and keep your trading very simple. Avoid fancy trading systems that promise high returns. Forget about neural networks and deep learning. These things don’t work as far as I know. You need to have the KISS mentality. KISS means Keep it Simple Stupid. Yes! This is what we will do. We will make our trading system as simple as possible and then practice it and try to make 100% return per month which translates to around 30% return per week.
We will make allowance for losing 5-6 trades per week and still make 30-40% per week. I will show you how to do it. We will develop a trading plan and that trading plan will become our forex trading bible. We will follow it meticulously. I have a very strong rule. If I lose 2 trades back to back in a day, I stop trading for the rest of the day. You see when you start losing, you can have a losing streak that can be 20 losing trades in a row. This used to happen in the beginning. I used to have a 50 pips stop loss and losing a few trades would wreck my trading account and wreck me mentally also.
You need to have a solid mental rule that will help you avoid a losing streak in a row. So I have this mental rule. If I lose 2 trades back to back in a row in one day, I call it a day for the rest of the day. I close the computer and come back the next day with a fresh mind. Remember the circuit breakers in the NY stock exchange that stop the trading if the price falls suddenly by a certain percentage. This rule is my mental circuit breaker and helps me avoid losing streaks that can become painful. If I make 50 pips per trade with a 10 pip stop loss, I just need 5 winning trades to make 250 pips per week. So basically this is what my trading plan is. I make 50-100 pips per trade. Each trade has a 10 pips stop loss and if I lose two trades in a row, I have the day off. I come back next day.
Daily and Weekly Pivots
We should avoid lagging indicators and focus on leading indicators. Pivot points are a leading indicator that is very simple and almost a century old. Just imagine Jesse Livermore, the greatest trader in history. He also used pivot levels. Keep this in mind. Pivot levels are used extensively by the professional traders in their daily trading. There are basically 3 important pivot lines: Daily, Weekly and Monthly. Daily Pivot Line is important for intraday trading. For us swing traders, Weekly Pivot line is a very important level that can tell you when a big trend is starting or not. This is the formula for calculating this level:
Weekly Pivot=(Last Week’s High+Last Week’s Low+Last Week’s Close)/3
As you can see this is a very simple formula. All the three variables used in the above formula are known. Nothing is confusing in this formula. Just add previous week’s high with the low and the close and divide the sum by 3. Pivot lines are leading indicators. These levels are calculated at the start of each week and work for the rest of the week giving you an important support and resistance level to watch.
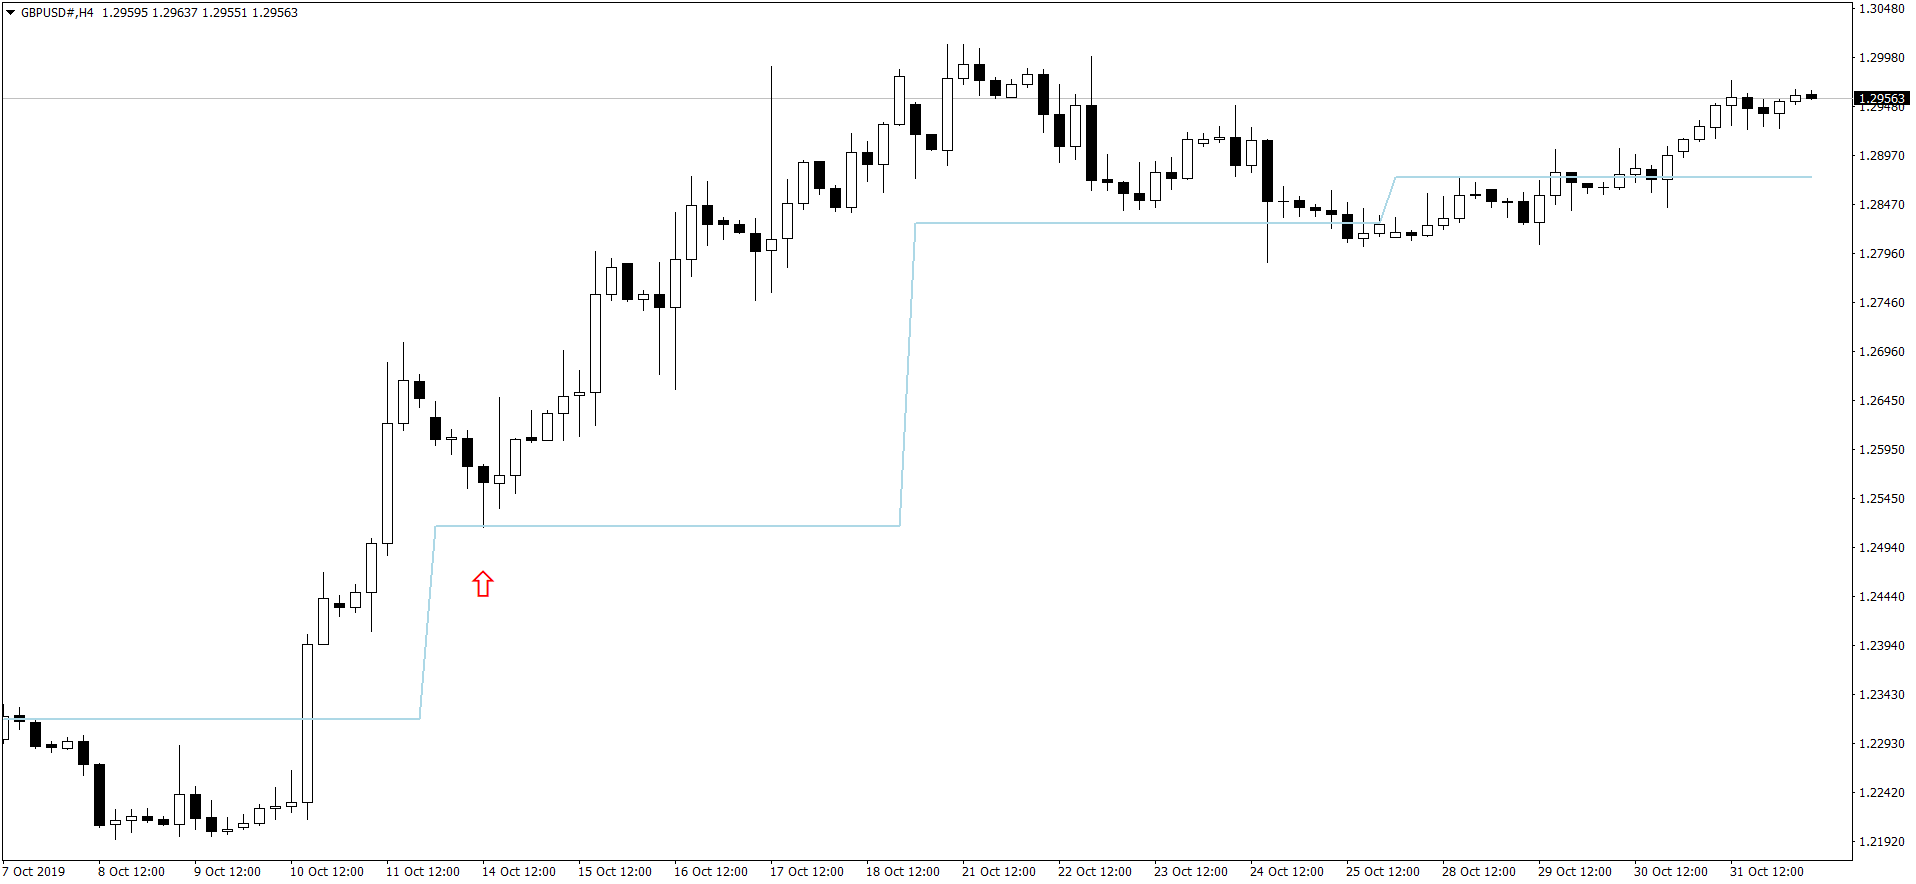
Most new traders get confused by the 3 support levels and the 3 resistance levels associated with each pivot line. We don’t need the 3 S/R levels associated with each Pivot line. Actually we only need the Weekly Pivot line on our charts to tell us when the big trend is going to start in the market. Weekly Pivot Line acts as a magnet for price action. Price tries to catch this Weekly Pivot Line. When it misses this line and can break it, it means start of a big move in the market. Take a look at the following GBPUSD H4 Chart.
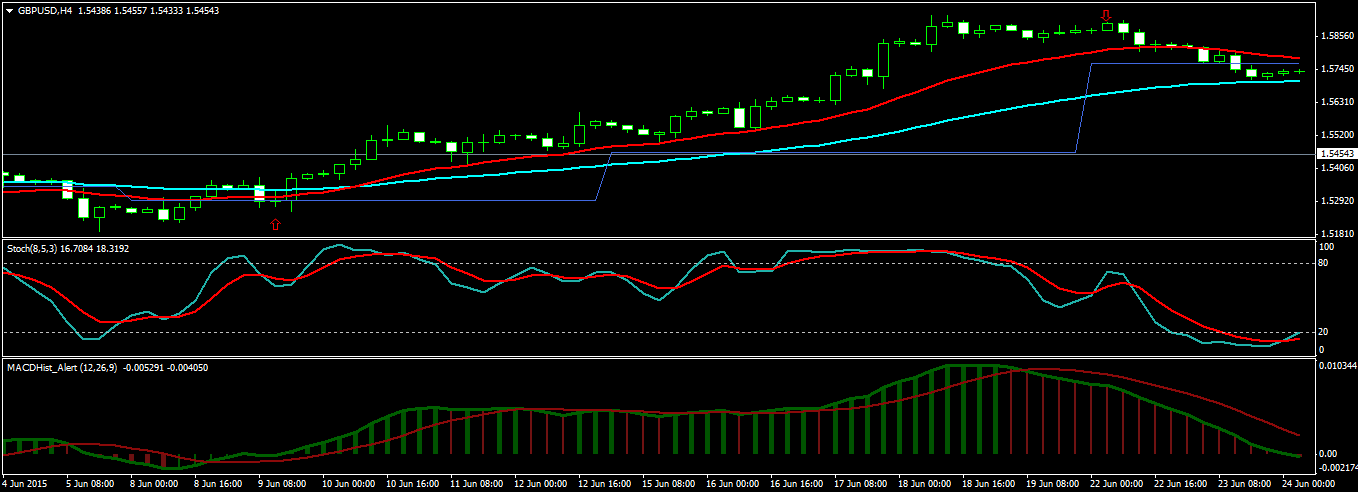
You see the blue line. This is the weekly pivot line. Just above the red arrow you can see price bouncing off from the weekly pivot line. Price is finding support at this line. Just above the red arrow we make an entry. Price is finding support at the weekly pivot line. We are sure this means a big move. We stay in the trade as long as the price stay above the red EMA21. We close the trade when price goes below the red EMA21 just below the down red arrow in the above screenshot. We make 650 pips in 9 days. By entering a new position everytime price bounced off the red EMA21, we could have multiplied this 650 pips into 1500 pips. This is a very simple strategy that works on H4. With this strategy you just need to check the chart once or twice daily. This strategy works for stocks and commodities as well. I will explain in subsequent posts how to add more positions without increasing the risk.
For now copy the Weekly Pivot Line code below and paste in your MT4 MetaEditor. Save the file as WeeklyPivot.mq4. Then hit the Compile button which will convert this mq4 file into an exe file. You are all set now. Open the Navigator window and you will find the WeeklyPivot indicator in the custom indicator list. Double click on it and you will find the blue line plotted on your chart. Weekly pivot line works best on H4 charts. As said above, in the next posts we are going to explain in detail how easy it is to trade with this line. You can also download the mql4 file and ex4 file below. Just click on File > Open Data Folder > MQL4 > Indicators and paste ex4 file in it. After that open your MT4 terminal and click on Navigator window and you will find this indicator in the list. Just double click on the indicator and it will get installed on the chart. Since this is a weekly pivot indicator, install it on H4.
Below is the MQL4 code for the weekly pivot trading strategy.
//+------------------------------------------------------------------+
//|                                                  WeeklyPivot.mq4 |
//|                                  Copyright © 2015, SwingTrader23 |
//|                                                                                                       |
//+------------------------------------------------------------------+
#property copyright "Copyright © 2015, SwingTrader23"
#property link      "https://www.doubledoji.com/"

#property indicator_chart_window
#property indicator_buffers 2
#property indicator_color1 RoyalBlue

//---- buffers

double Pivot[];

//+------------------------------------------------------------------+
//| Custom indicator initialization function                         |
//+------------------------------------------------------------------+
int init()
{
//---- indicators
SetIndexStyle(0,DRAW_LINE,STYLE_SOLID);
SetIndexBuffer(0,Pivot);

IndicatorDigits(Digits);
//----
return(0);
}
//+------------------------------------------------------------------+
//| Custom indicator deinitialization function                       |
//+------------------------------------------------------------------+
int deinit()
{
//----

//----
return(0);
}
//+------------------------------------------------------------------+
//| Custom indicator iteration function                              |
//+------------------------------------------------------------------+
int start()
{
int    counted_bars=IndicatorCounted();

if(counted_bars<0) return(-1);
//---- last counted bar will be recounted if(counted_bars>0) counted_bars--;
int limit=Bars-counted_bars;
//****************************

for(int i=0; i<limit; i++)
{

// Used to limit the number of days
//if ( (i<((DaysToPlot+1)*BarsInDay))||DaysToPlot==0)
{  // that are mapped out. Less waiting ;)

// *****************************************************
//    Find previous day's opening and closing bars.
// *****************************************************

//Find Our Week date.

datetime WeekDate=Time[i];
int WeeklyBar        =  iBarShift( NULL, PERIOD_W1, WeekDate,false)+1;
double PreviousHigh  =  iHigh(NULL, PERIOD_W1,WeeklyBar);
double PreviousLow   =  iLow(NULL, PERIOD_W1,WeeklyBar);
double PreviousClose =  iClose(NULL, PERIOD_W1,WeeklyBar);

/*
int PreviousClosingBar = FindLastTimeMatchFast(CloseMinutesIntoDay,i+1);
int PreviousOpeningBar = FindLastTimeMatchFast(StartMinutesIntoDay,
PreviousClosingBar+1);

double PreviousHigh= High[PreviousClosingBar];
double PreviousLow = Low [PreviousClosingBar];
double PreviousClose = Close[PreviousClosingBar];
*/
// *****************************************************
//    Find previous day's high and low.
// *****************************************************

// ************************************************************************
//    Calculate Pivot lines and map into indicator buffers.
// ************************************************************************

double P =  (PreviousHigh+PreviousLow+PreviousClose)/3;

Pivot[i]=      NormalizeDouble( P, Digits);

}
}

// *****************************************
//    Return from Start() (Main Routine)
return(0);
}
//+----------------------------------------------------------------+
//  END Custom indicator iteration function
//+----------------------------------------------------------------+
Now when I had wrote this post, it was a few years ago. In the last few years, I have improved upon this trading strategy and now I use daily pivots more because daily pivots give me more trading signals as compared to weekly pivots. So I am updating this post and add daily pivots to it also. In the last few years, MetaQuotes Corporation has updated the MT4 platform a number of times. So I have coded a new Intraday Pivots indicator that you can copy the code below. You will love this new Intraday Pivot indicator. This indicator can draw weekly and daily pivots as well as 4 hourly pivots.
//+------------------------------------------------------------------+
//|                                              Intraday_Pivots.mq4 |
//|                                                     Ahmad Hassam |
//|                                        https://tradingninja.com/ |
//+------------------------------------------------------------------+

#property copyright "Ahmad Hassam"
#property link      "https://www.doubledoji.com/"
#property version   "1.00"
#property description "A Pivot Point Indicator"
#property indicator_chart_window
#property indicator_buffers 2
#property indicator_plots   1

//--- plot Pivot
#property indicator_label1  "Pivot"
#property indicator_type1   DRAW_LINE
#property indicator_color1  clrLightBlue
#property indicator_style1  STYLE_SOLID
#property indicator_width1  2


//--Pivot timeframe period that you want like daily or weekly
input int  pivotPeriod=120; // H4=4, D1=24 and W1=120

ENUM_TIMEFRAMES period;

//--initialize variables
double Pivot;
int pivotBar;
datetime barTime;
double pivotHigh;
double pivotLow;
double pivotClose;

//—- buffers

double pivot[];

//+------------------------------------------------------------------+
//| Custom indicator initialization function                         |
//+------------------------------------------------------------------+
int OnInit()
  {
//--- the indicator subwindow label name
IndicatorSetString(INDICATOR_SHORTNAME, "IntraDayPivot");
//--- indicator buffers mapping
//—- indicators
SetIndexBuffer(0,pivot, INDICATOR_DATA);
ArraySetAsSeries(pivot,true);


//--check the pivot period
if (pivotPeriod==4) period=PERIOD_H4;
if (pivotPeriod==24) period=PERIOD_D1;
if (pivotPeriod==120) period=PERIOD_W1;


//---
   return(INIT_SUCCEEDED);
  }
//+------------------------------------------------------------------+
//| Custom indicator iteration function                              |
//+------------------------------------------------------------------+
int OnCalculate(const int rates_total,
				const int prev_calculated,
				const datetime &time[],
				const double &open[],
				const double &high[],
				const double &low[],
				const double &close[],
				const long &tick_volume[],
				const long &volume[],
				const int &spread[])
  {
//---


   int bars = rates_total - 1;
   if(prev_calculated > 0)
     {
      bars = rates_total - prev_calculated;
     }

   for(int i = bars-1; i >= 0; i--)
     {

     barTime=iTime(NULL,0,i);
     pivotBar = iBarShift(NULL,period, barTime)+1;

//--
     pivotHigh=iHigh(NULL,period,pivotBar);
     pivotLow=iLow(NULL,period,pivotBar);
     pivotClose=iClose(NULL,period,pivotBar);
     Pivot=(pivotHigh+pivotLow+pivotClose)/3;
     pivot[i]=NormalizeDouble(Pivot,Digits);


     }
//--- return value of prev_calculated for next call
   return(rates_total);
  }
//+------------------------------------------------------------------+
Now why use daily pivots? As I said above we need good trading signals daily that can help us make at least 300-500 pips per week. Daily pivots can provide just that. Just like the weekly pivot when price finds support at the weekly pivot it means a 150-450 pip move. Similarly when price finds resistance at the daily pivot, it means a 50-100 pip move. If we can catch 50-100 pips with a small stop loss, we have a very solid trading system. Take a look at the screenshot below!
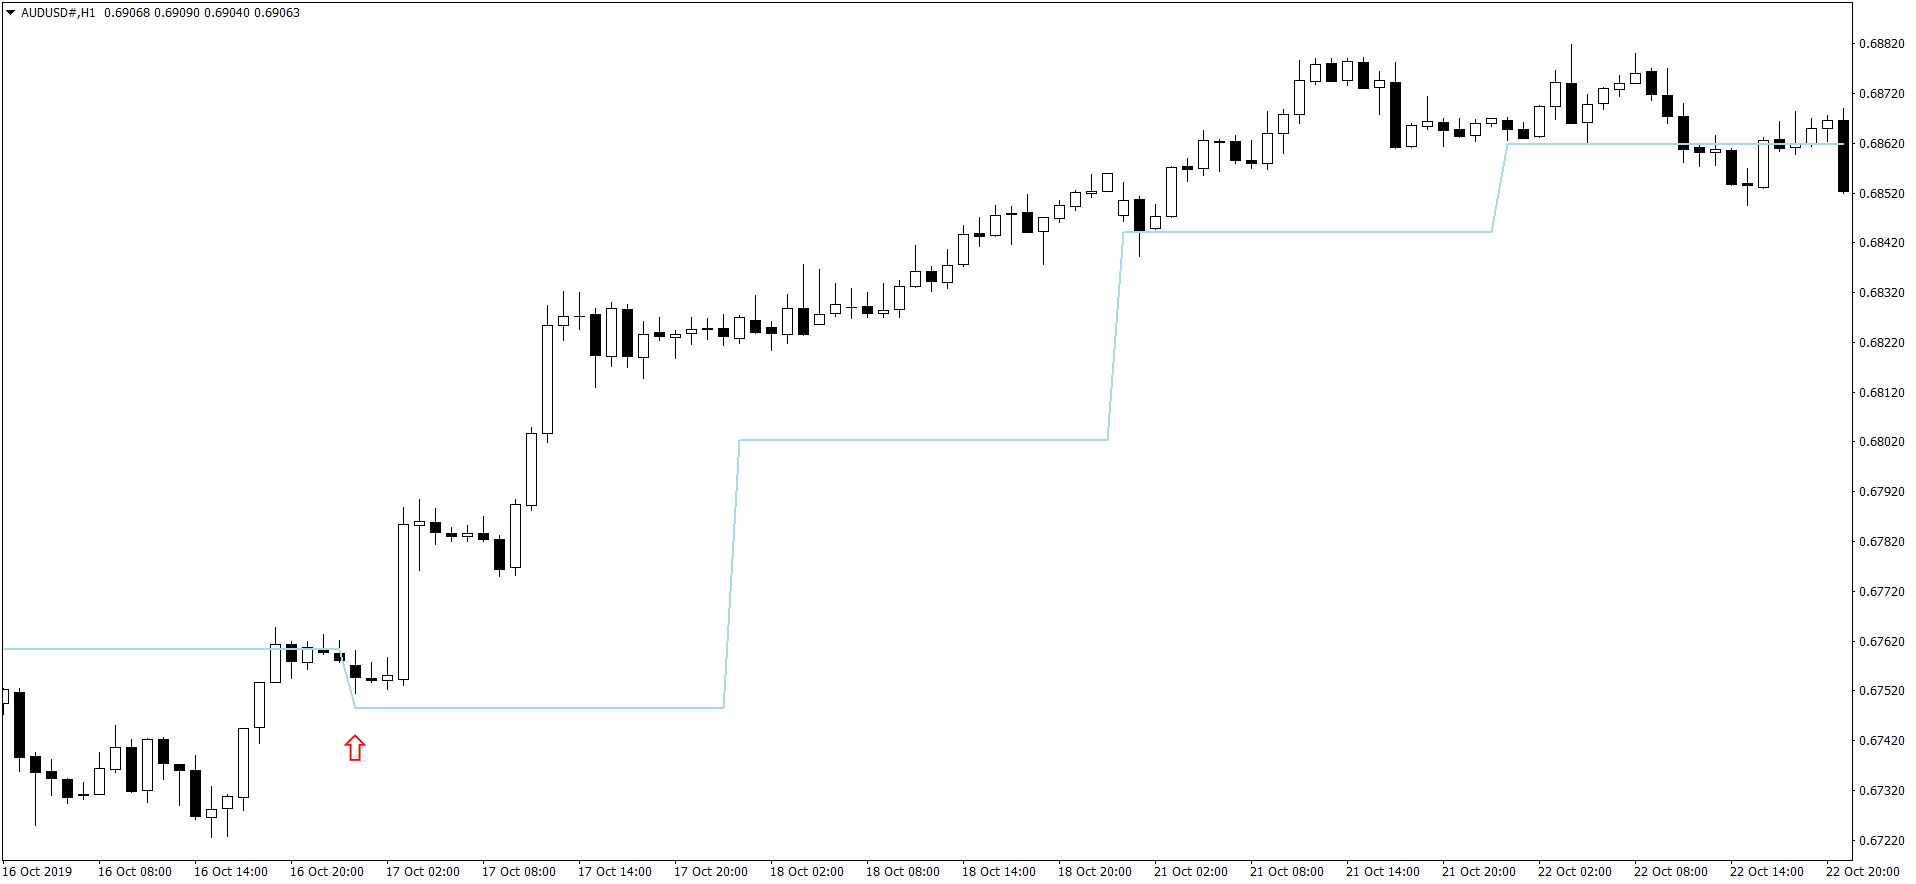
Above you can see AUDUSD buy trade on H1 chart that made around 120 pips. When the price goes above the daily pivot, it means a buy signal. As you can see in the above chart, price finds support at the daily pivot just above the red arrow. This is the signal for entry. How many indicators there are on the above chart? Only one. We don’t need moving averages now. We just have the daily pivot line and price action. We need a little experience with reading candlestick patterns and we can identify great trades with our KISS trading system.
Why Reward/Risk for a Trade is Important?
The pivot line which is a leading indicator and is just the sum of the previous day high, low and close divided by 3. You get a low risk entry with a stop loss less than 10 pips. This is just what we want. A low risk entry that has the potential to make 50-100 pips. If we make 50 pips, the Reward/Risk for the trade would be 5:1 and if we make 100 pips, we have a Reward/Risk of 10:1 which is perfect. When we trade we take care of the Reward/Risk (R/R). As long as we have an average R/R of 5:1 we will always make more than we lose.
Let me explain Reward/Risk more. Suppose we make 10 trades. Suppose our average winrate is just 50%. Out of 10 trades, we lose 5 trades and we win 5 trades. Suppose our average Reward/Risk is 5:1. In our case suppose we always have a stop loss of 10 pips and a take profit of 50 pips. When we win 5 trades, we make 250 pips and when we lose 5 trades we lose 50 pips. So we make a net of 200 pips which is not bad. If our winrate had been 70% we would have lost 3 trades and won 7 trades. We would have made 350-30=320 pips. Now you can see why Reward/Risk is very important in trading. We want a trading strategy that can give us a low risk entry with a potential to make at least 50 pips. Sometimes we make 100 pips and sometimes we make even more.
What is a 5 Star Trade?
When I open a trade, I look at the preceding price action. Preceding price action also gives you a clue whether this is the right signal or not. Just going above a pivot line or going below a pivot line is not enough. What we want is a 5 star trade. 5 star trade means that there are other indicators that also provide confirmation. So keep this in mind. Pivot line is just one signal. We need to confirm this signal. Once we have a trading system, we practice it daily and we don’t deviate from it. This is the secret to your forex trading success.
In the beginning, you will lose a lot. I have lost 20 trades in a row and sometimes more. But using strict risk management rules, I have not experienced a big drawdown. I just need one good 100 pips trade to recover all the loss. This was what used to happen in the beginning. Then I improved my trading system and now I lose less. But keep this in mind. You will keep on losing. The trick lies in not losing your emotional balance, following strict risk management in each trade and staying focused.
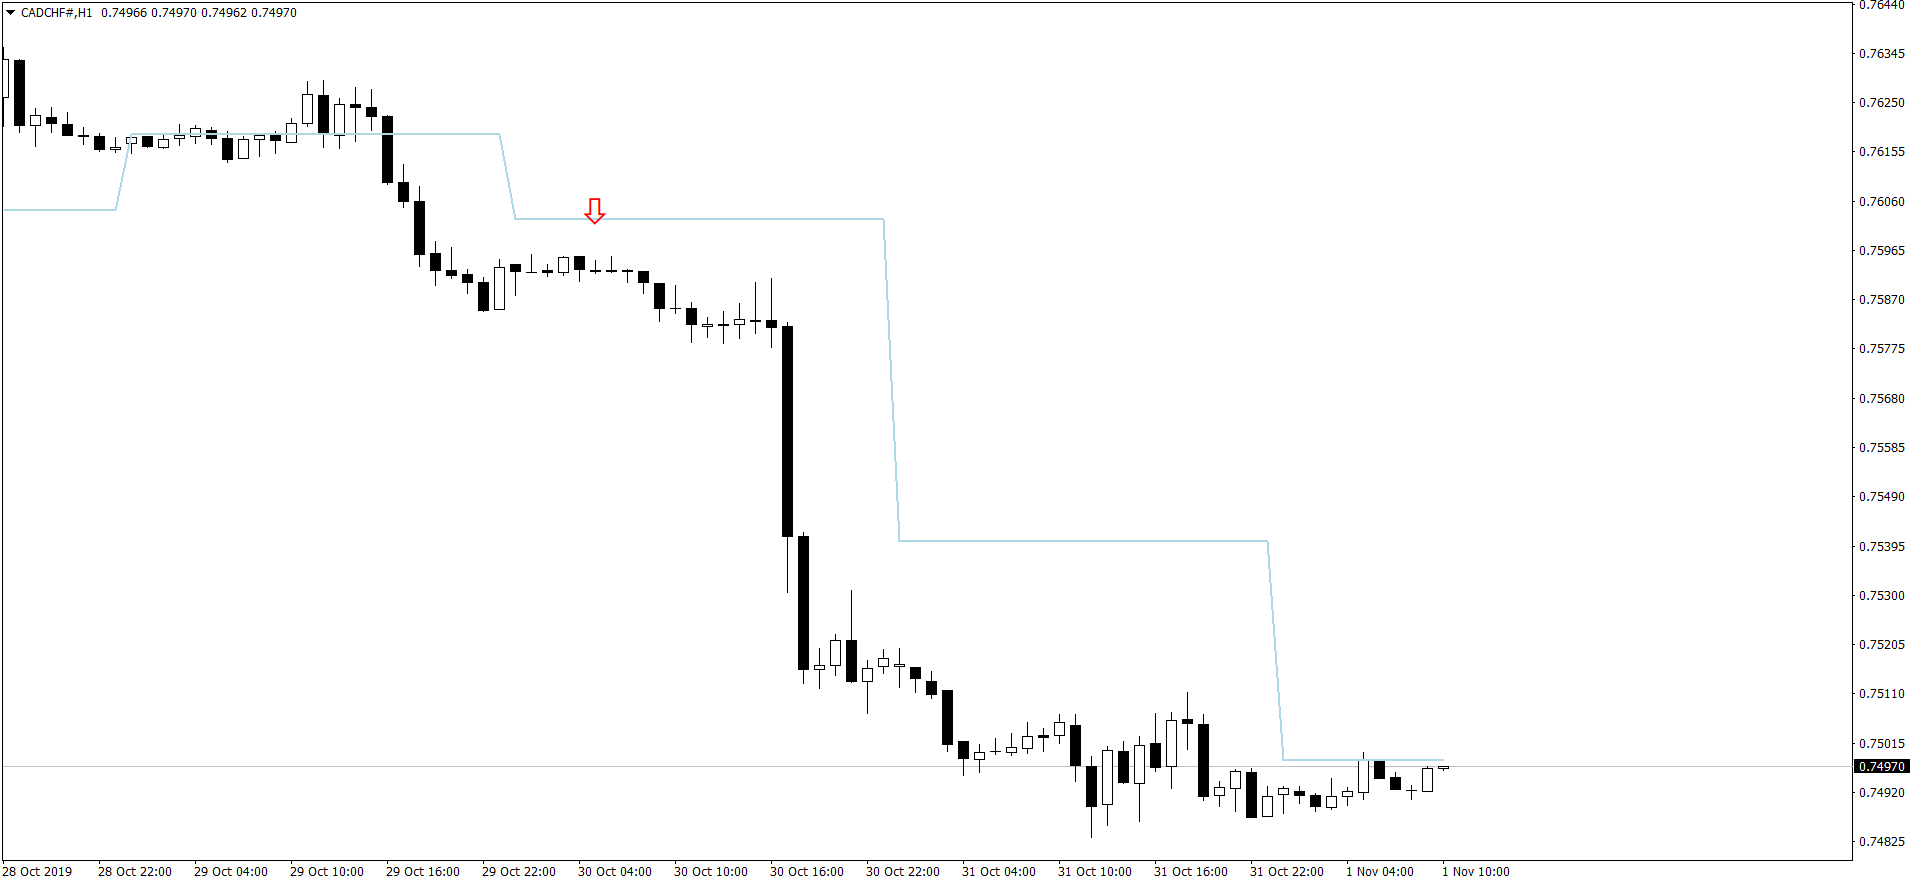
Above is a CADCHF sell trade. Once again you see daily pivot provided us with a very nice low risk entry. We don’t make entry on an impulse. We watch the price action for a number of hours and then make a decision to enter the trade or not. The more pairs you are going to trade, the more trading signals you will get. As said above our aim is to make 30-40% per week with low risk of 10 pips per trade. The above CADCHF trade made more than 100 pips and as you can see, it lasted more than 24 hours.
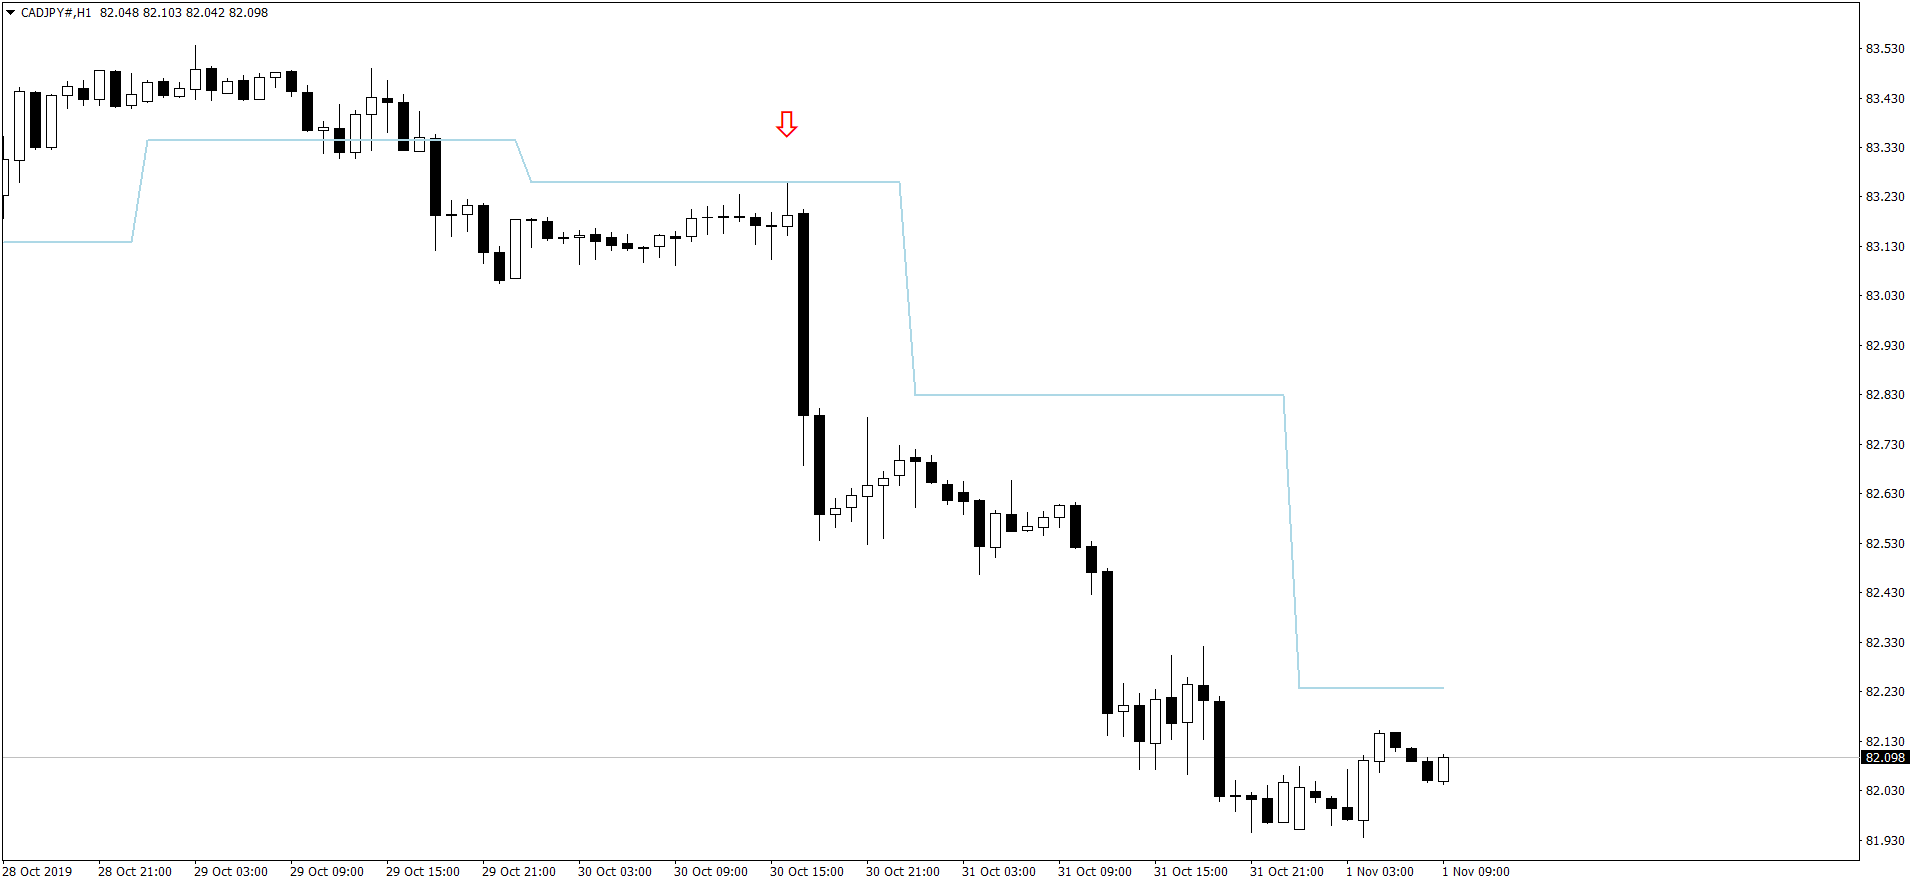
Above is a CADJPY sell trade. Once again the daily pivot provided us with a nice 5 star trade. We make a low risk entry and boom, you can see price went down more than 100 pips in the next 24-48 hours. When we enter into a trade, price does not achieve its target quickly. It can take 24-48 hours for the price to reach its target. So you need to be patient. This is what I do. When I have opened a trade, I close the trade and reward myself by going to sleep or doing other things that I love to do. This allows you to rest and recoup your energies for your daily battle with the market. Sitting in front of the computer after opening a trade can make you wrong decisions. You can easily get confused and close a trade thinking that price is retracing. I have done it many times in the beginning. After closing the trade, you see price making a big move in the direction that you had opened the trade. So it is better to close the computer and do other things after opening a trade.
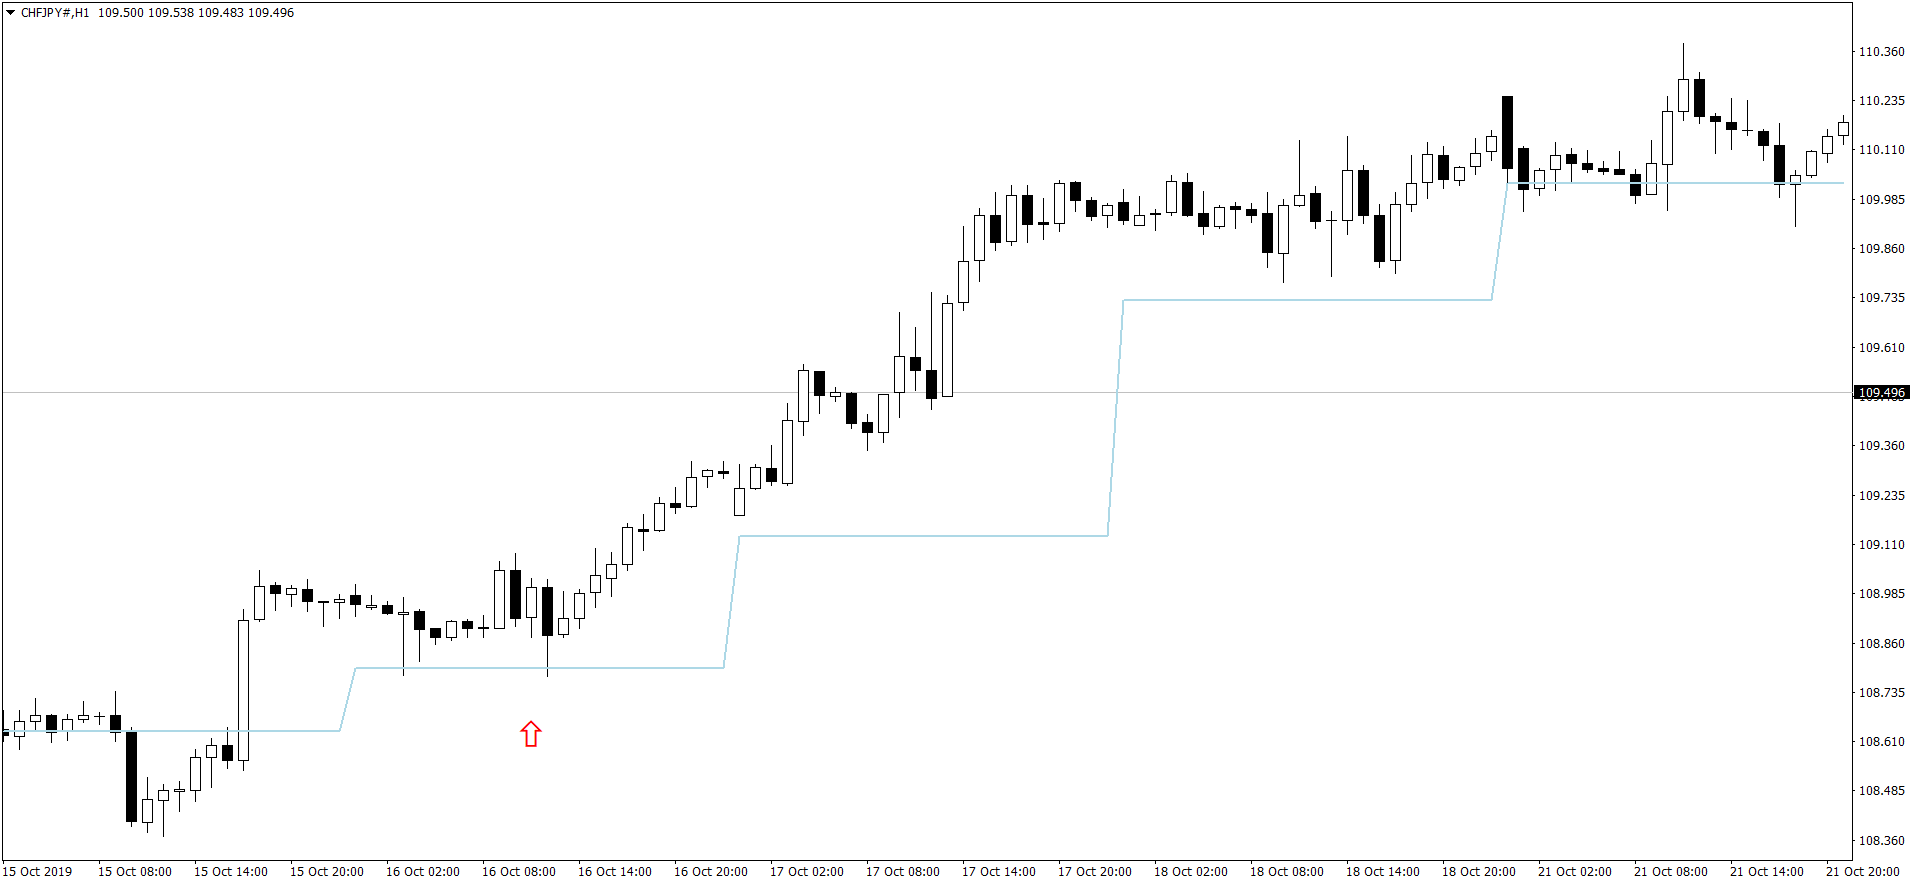
Above is a CHFJPY buy trade on H1. You can see price finding support above the daily pivot line just above the red arrow. You will observe the price action for a couple of hours. Once you are convinced that price is really finding support at the daily pivot line, you will enter into a buy trade. Our stop loss should be less than 10 pips. As you can see this CHFJPY long trade also made more than 100 pips. Trading with minor pairs like the CHFJPY has a problem though. You will have to pay a wider spread as compared to trading the major pairs. Mostly the spread will be between 4-6 pips. This is the price you pay to the broker for entering into a trade.
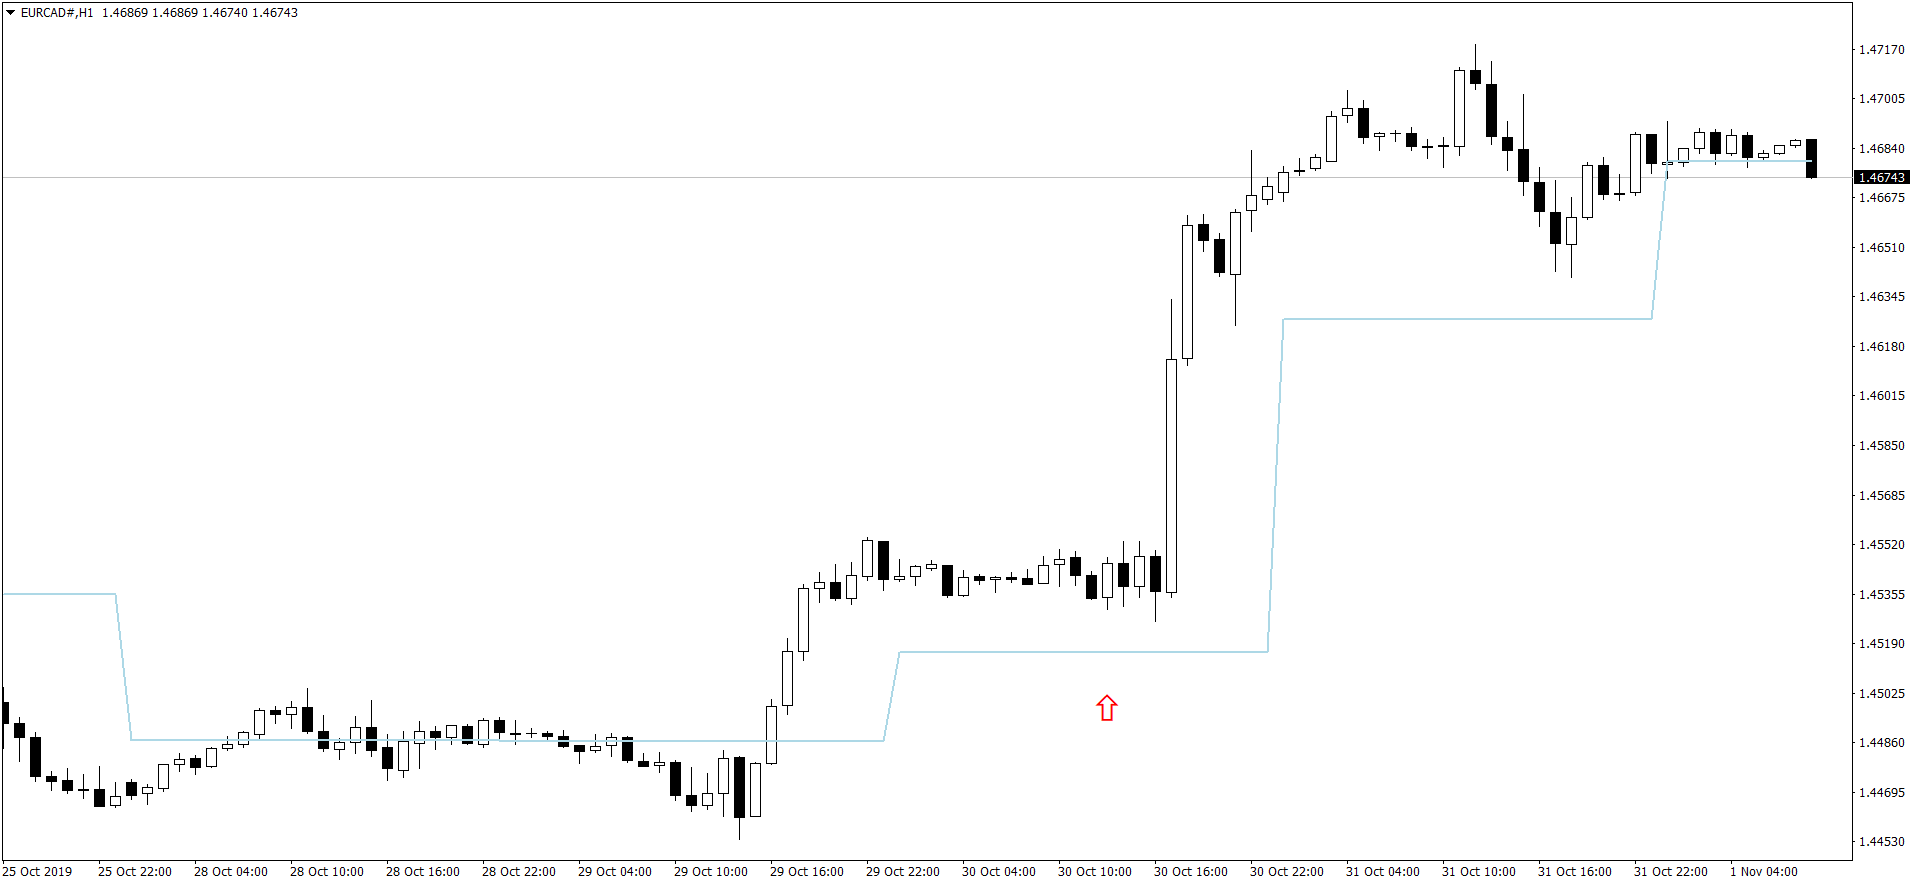
Above is a EURCAD buy trade on H1 chart. As you can see price is finding support at the daily pivot line. We observe the price for a few hours and then make a decision to enter into a buy trade. As you can see this trade also make more than 100 pips. Most of the time, I prefer 100 pips trade with a stop loss of 10 pip. This gives me a Reward/Risk of 10:1. But you can never predict how much price will move. So if you make 50 pips instead of 100 pips, it is also good as our Reward/Risk is 5:1 which is also good.
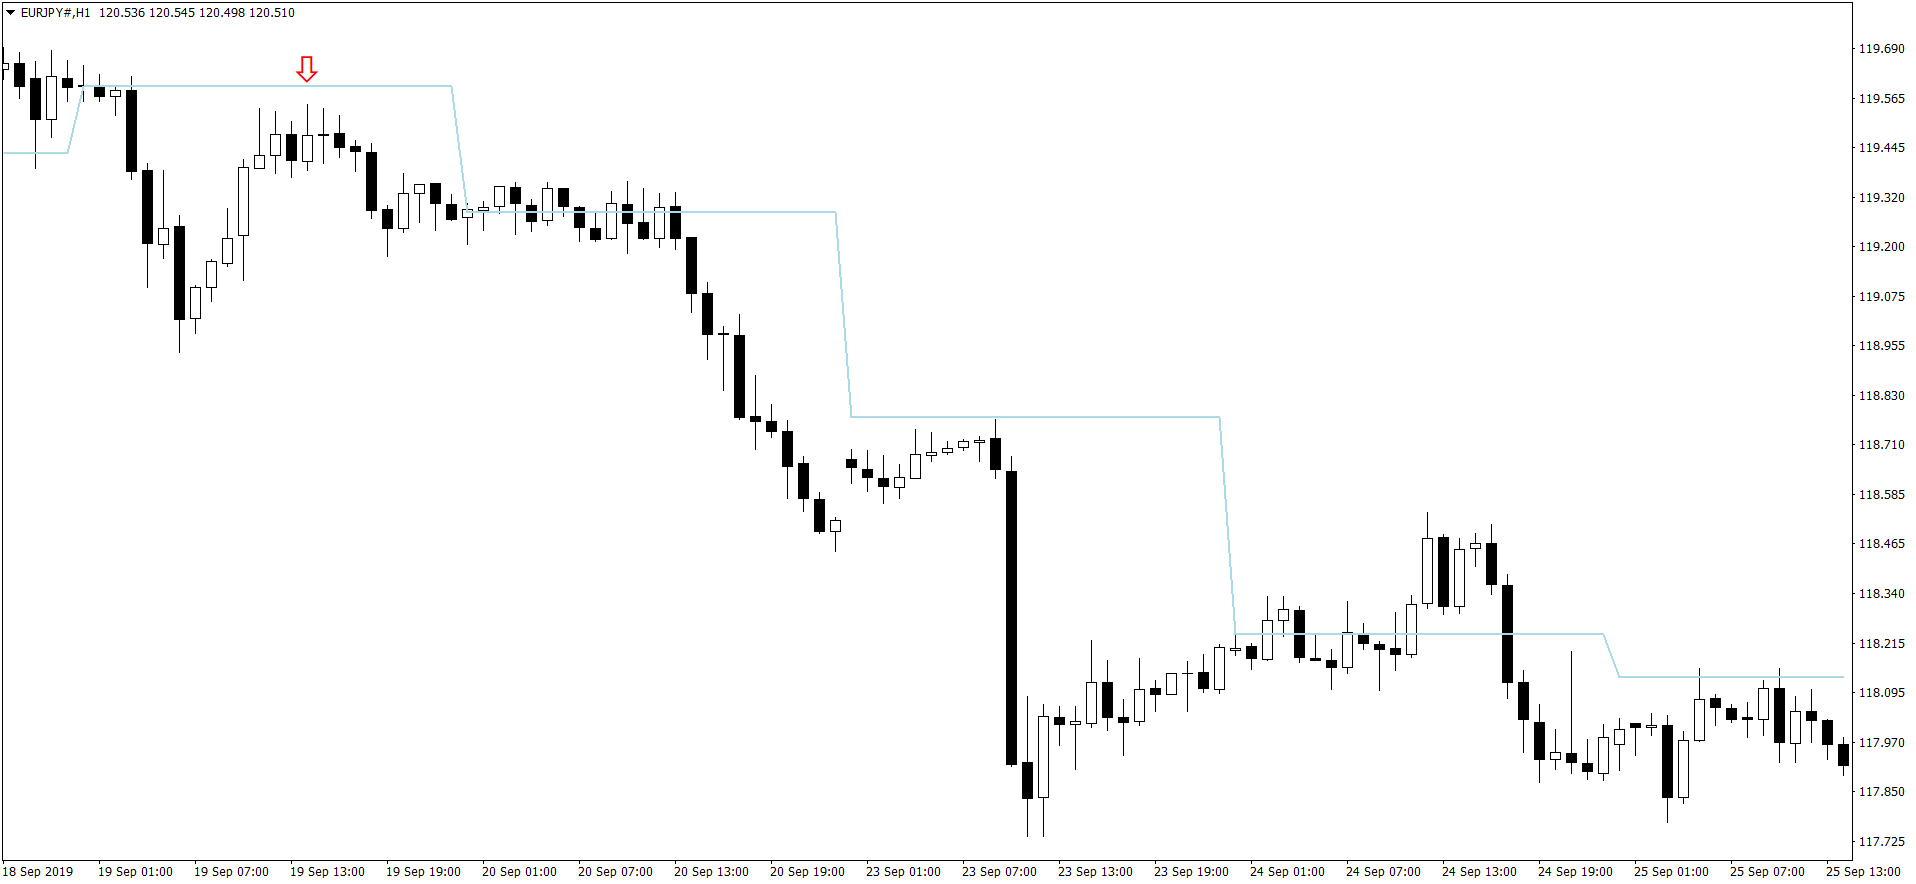
Above is a EURJPY sell trade. Once again we use the daily pivot line to make a decision. Once we have observed the price for a few hours and we are sure that price is indeed finding resistance at the daily pivot line, we make an entry. So when you trade with my daily pivot trading strategy, you get a few hours to make your trade decision. This is something good. You get ample of time to make up your mind and check other indicators and find confirmation that price will go down. I used to trade on lower timeframe charts. Lower timeframes like M5, M15 and M30 are very fast. There is a lot of noise on the lower timeframe. We need to make quick decisions and reward is most of the time not good. So avoid trading on lower timeframe charts.
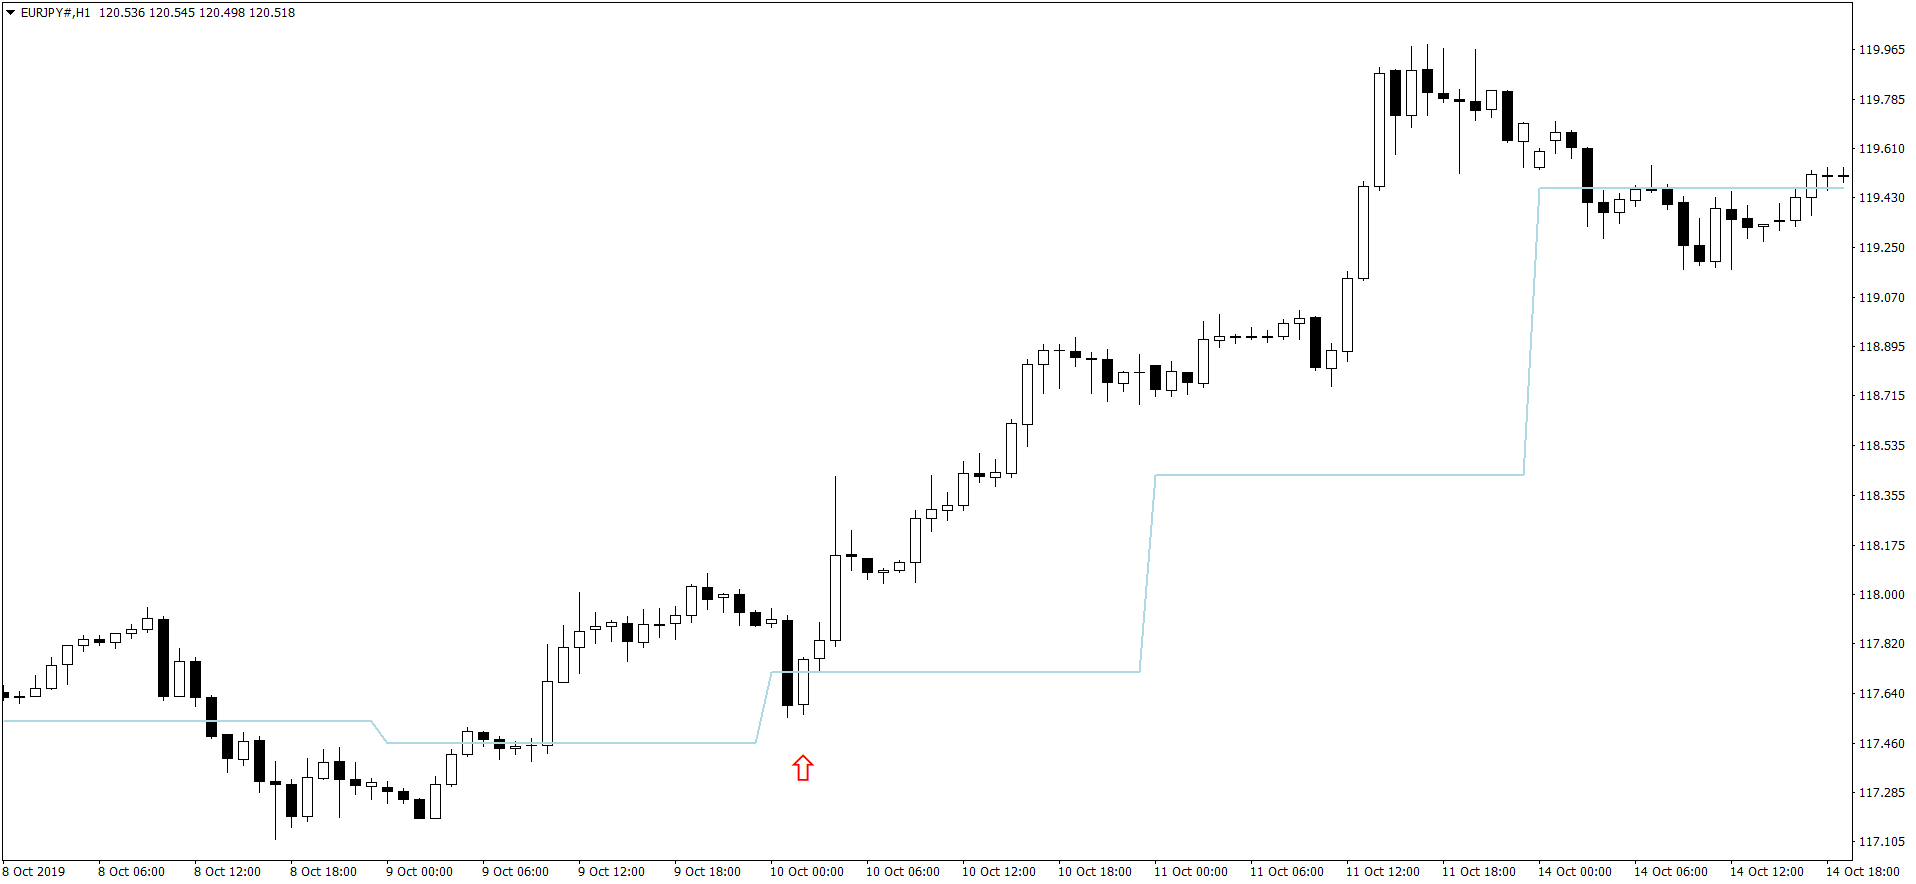
Above is another EURJPY buy trade. We get a very nice bullish candle formed on the daily pivot line. We take our chance and open a trade. This trade also made more than 100 pips. By now you must be convinced that daily pivot is an important level. Yes it is. We just need to use the daily pivot and decide when we should go long and when we should short.
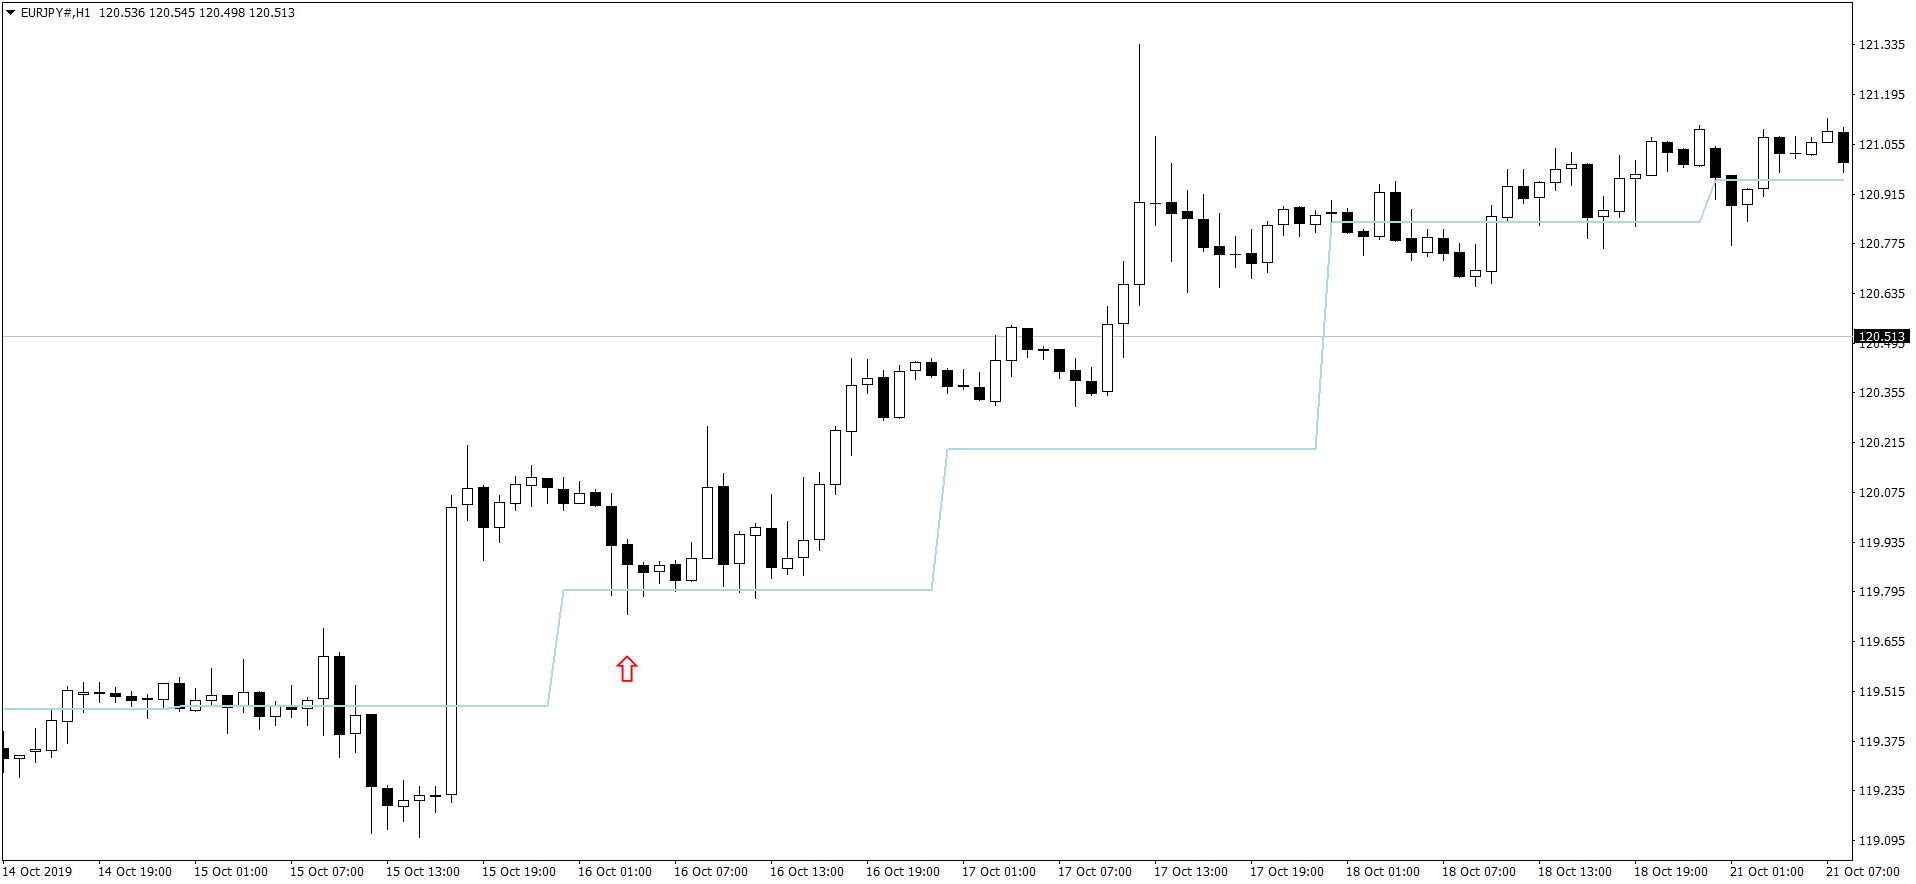
Above is one more EURJPY buy trade. As you can see in the above chart, price is finding very strong support at the daily pivot line. We open a buy trade with a small stop loss. It is always a good idea to have a take profit target of 100 pips. Price can move more. But using a profit target of 100 pips, you make your trade set and forget. After opening the trade as I said above, close the computer. Go for shopping or do other things. It take 24-48 hours for the price to hit its profit target If you have made the right entry, you will always find the trade going when you open your computer after 24 hours and check how the trade is going.
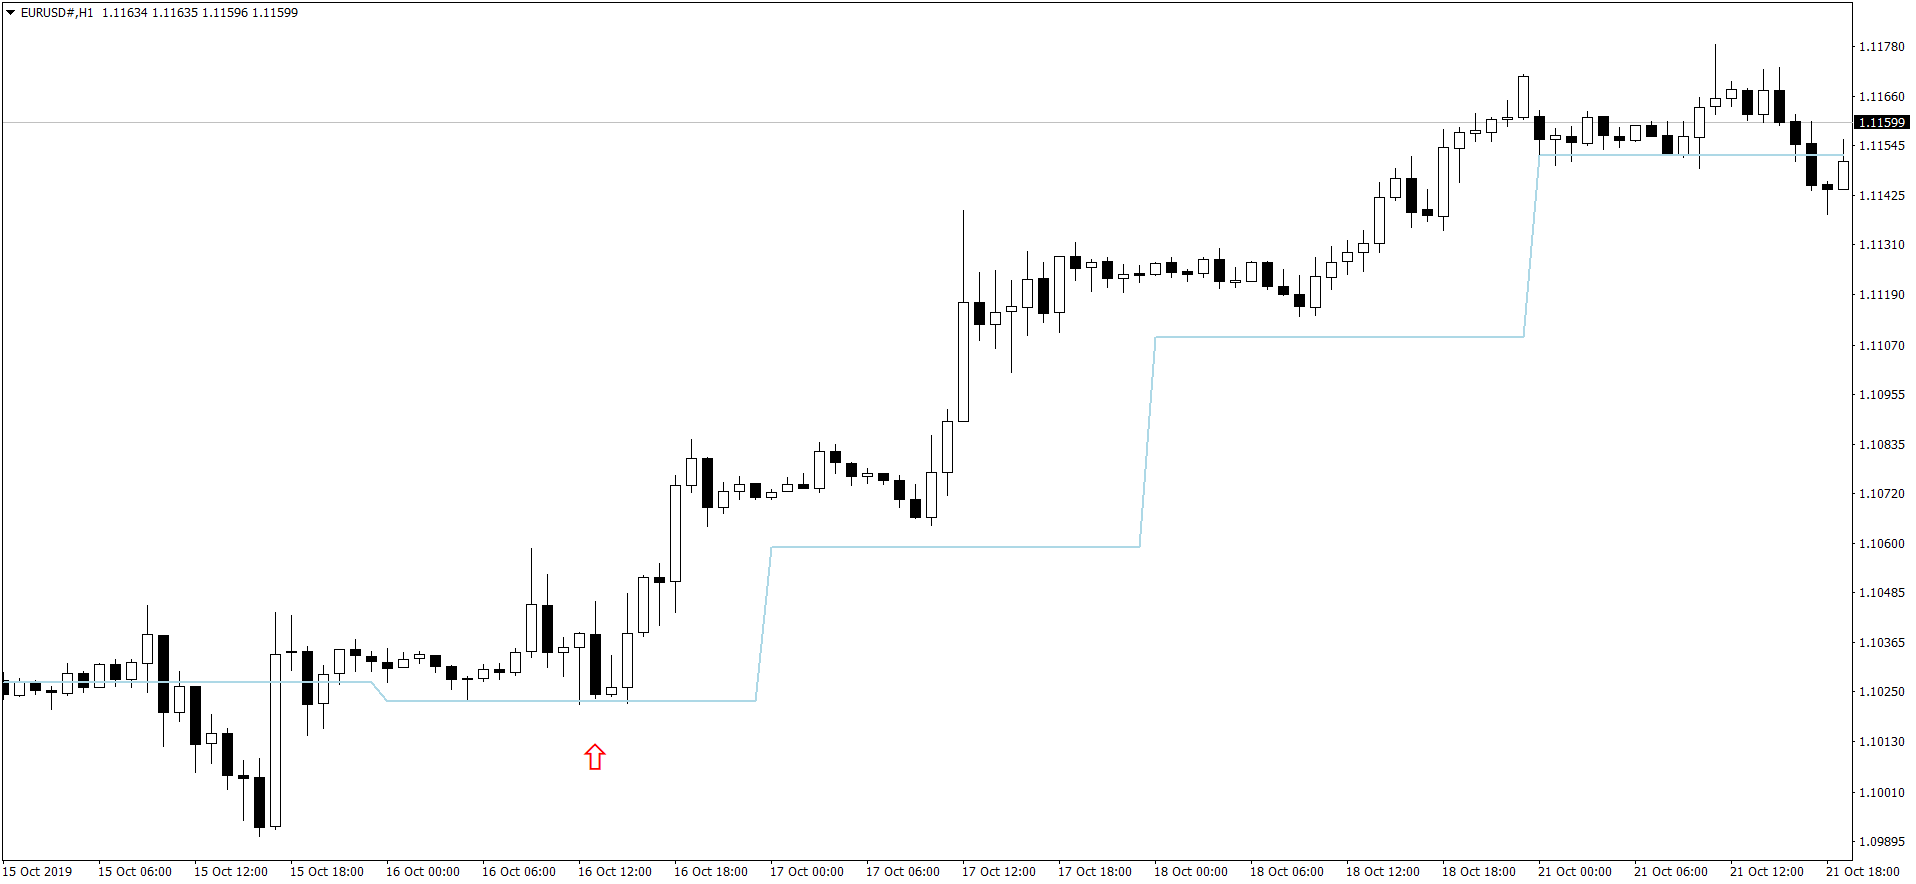
Above is a EURUSD buy trade. As you can see price is finding strong support at the daily pivot line. We open the buy trade with a small stop loss. It took more than 48 hours for the price to reach its profit target of 100 pips. As long as the price stays above the daily pivot line, you should not worry about the trade. When price goes below the pivot line, it is time to close the trade.
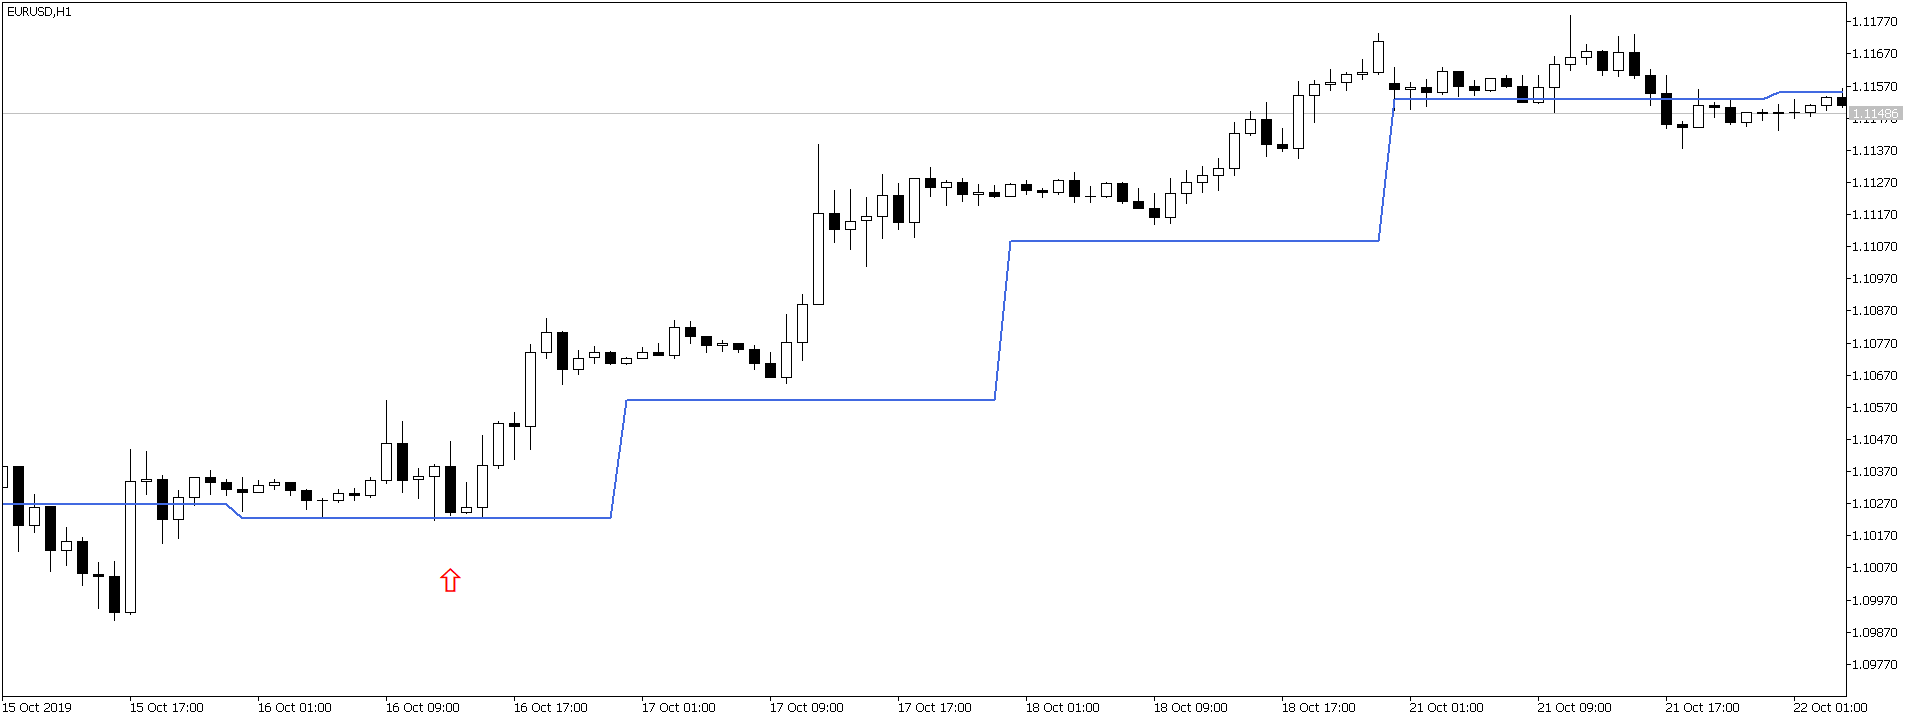
Above is another EURUSD long trade. As you can see price is finding support at the daily pivot line. This is our entry signal. First there was a bullish candle formed right on the daily pivot line. After that next day, we see that price is finding support at the daily pivot line. This is our buy signal. Now keep this in mind, we want to catch 50-100 pip moves in the market with a small stop loss of 10 pips. This is what our trading strategy is in crux. Just a reminder!
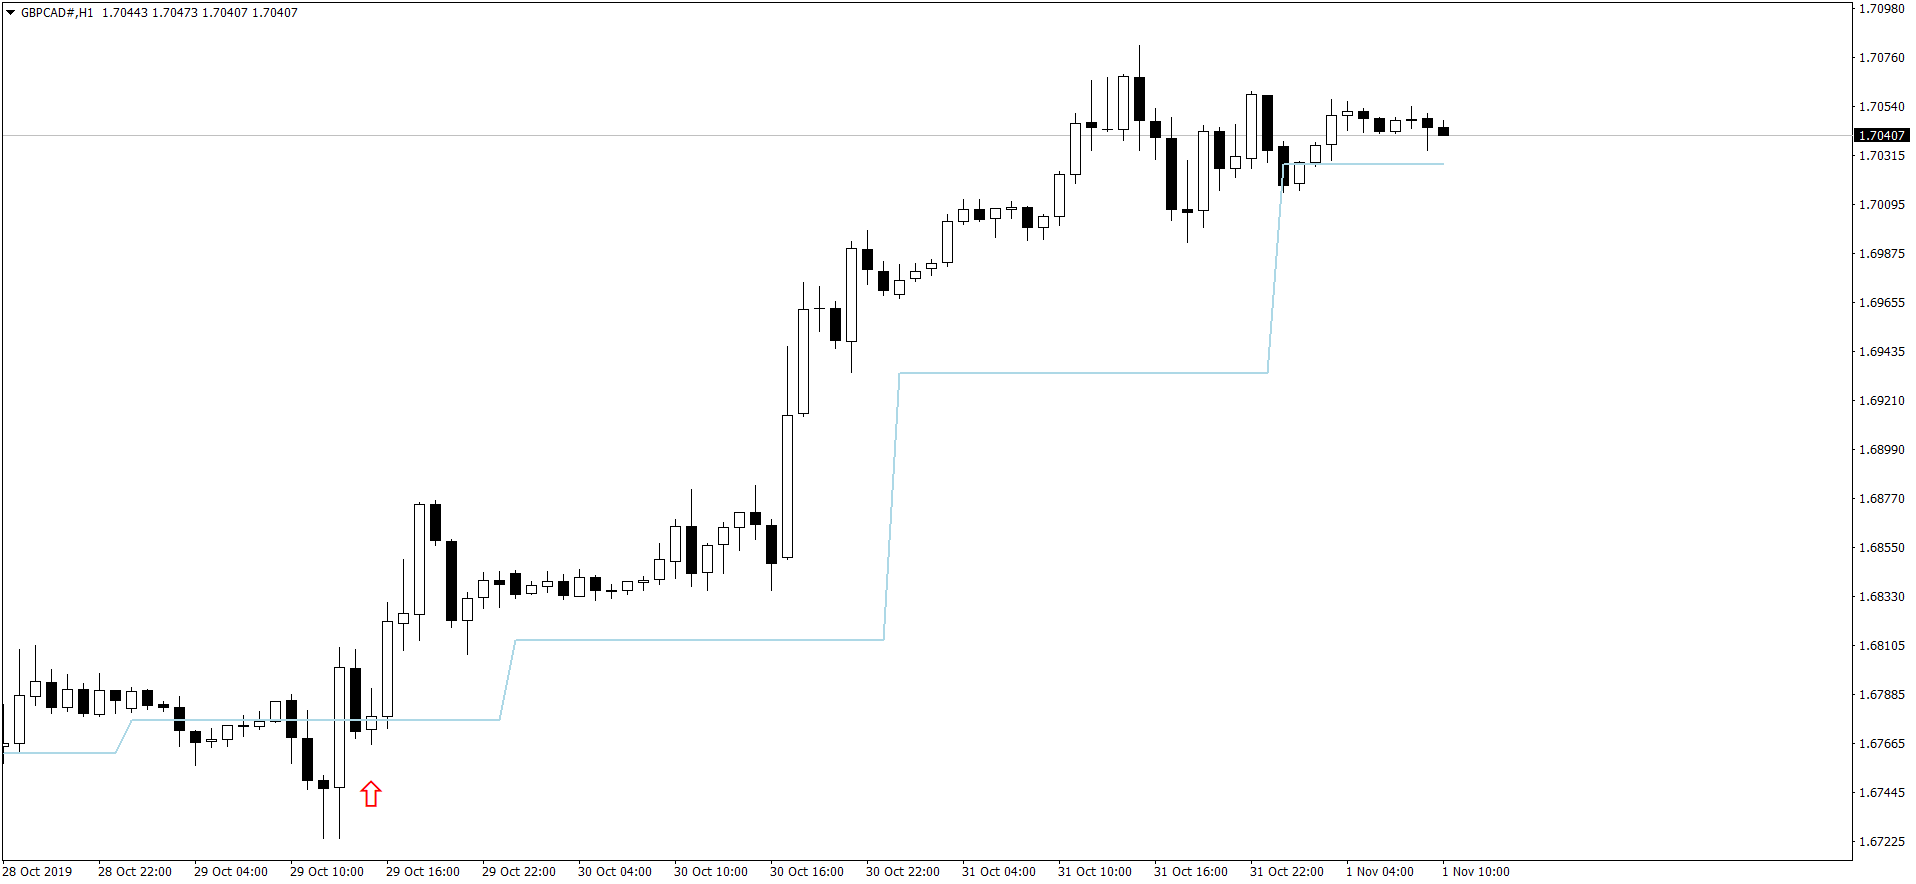
Above is GBPCAD long trade. We enter on the bullish candle formed right at the pivot line. We are always looking for very low risk entries. I always avoid trading big candles. Just keep this in mind. Before every breakout, price moves in a small narrow range. This is the best time that we can identify a low risk entry. The stop loss is less than 10 pips.
Spread is a cost that you should minimize
As said above we have to take care of the spread also. For minor pairs like GBPCAD, my broker is asking for a spread of 5 pips. So I have to take care of the spread also. In the long run, spread is a cost that you will have to think about. If you are trading with 10 standard lots than a spread of 2 pips translates into $200. If you make 2 trades daily than daily you pay $400 to your broker. In a week it comes to $2K. In a month it is $8K and in a year it is $96K. So in a year if you are trading with 10 standard lots, you will be paying $100K to your broker. Can you afford to pay this much amount to your broker in a year? Think about it.
Winning and losing doesn’t count here. You have to pay the spread to your broker whenever you open a trade. Rather the spread is included in the price when you open a trade. In the long run, when you become successful, you will have to think about the spread. You will have to look for a low spread broker. Most ECN brokers are low spread. There are brokers who charge 1 pip for EURUSD and 2 pips for GBPUSD. You should do your research and select a broker who is reliable and not a cheat.
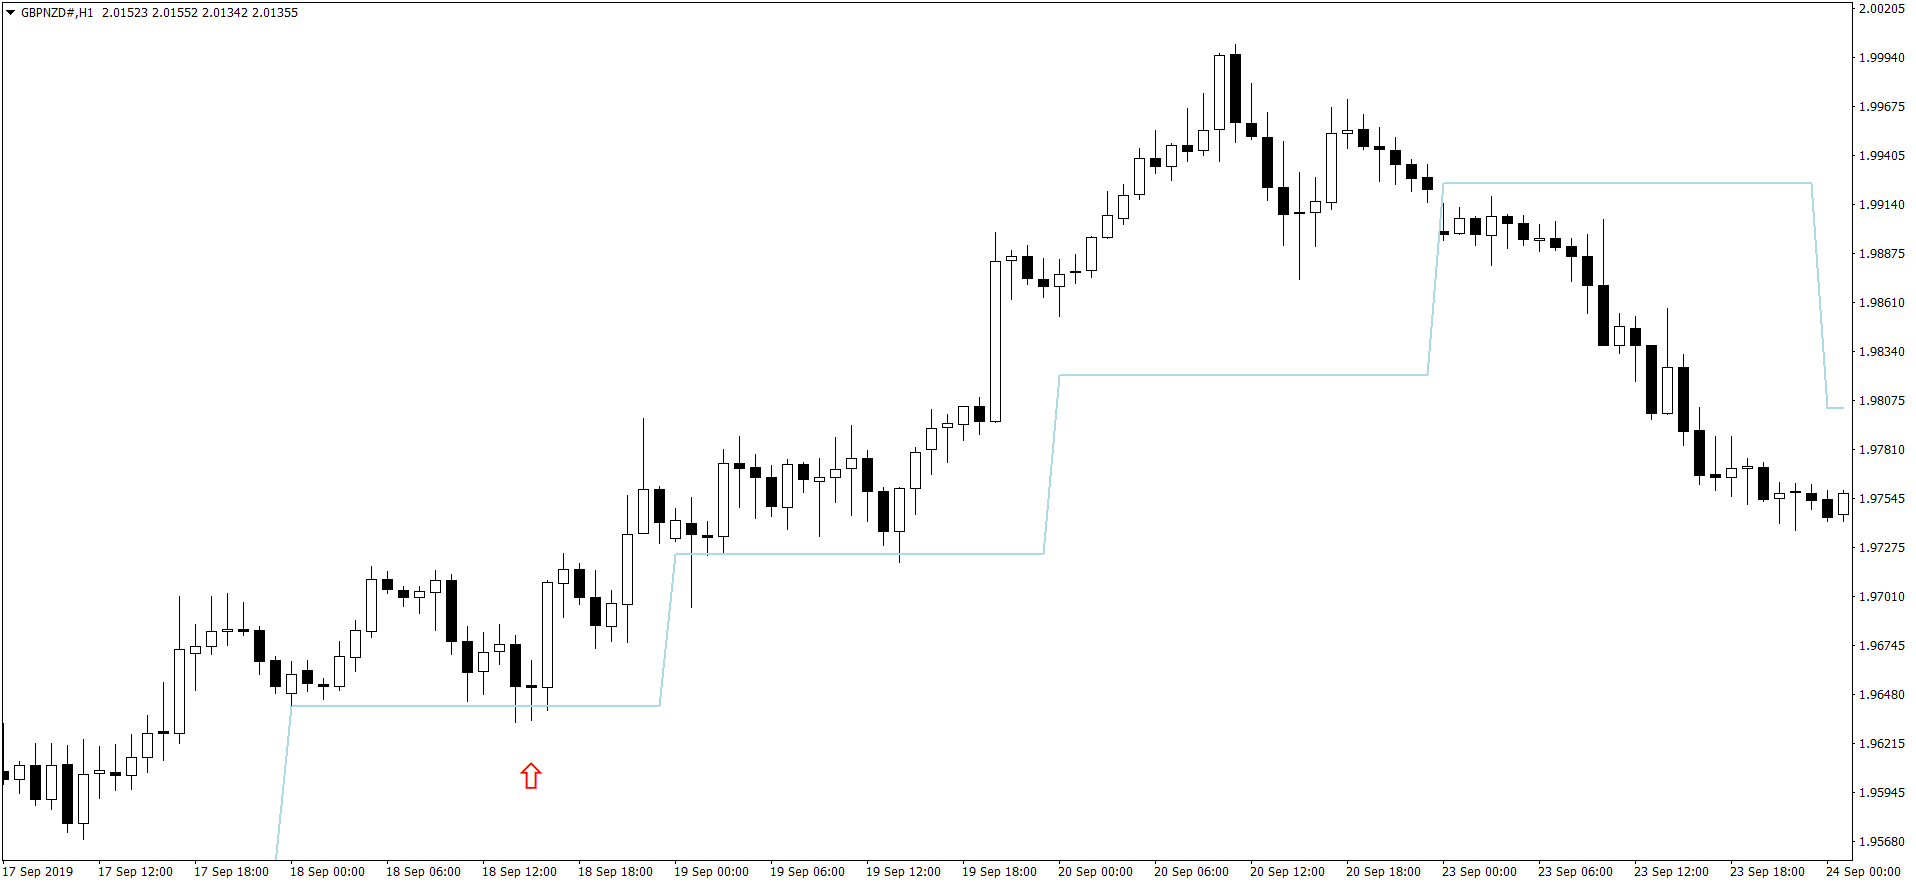
Above is GBPNZD long trade. As I have said above again and again. I always go for low risk entries that minimize my risk per trade. I always go for at least 50 pips profit target when I open a trade. If I think market is not going to move 50 pips and more, I don’t take the signal. Daily pivots as you can see now help me filter trades that can make 50-100 pips per trade.
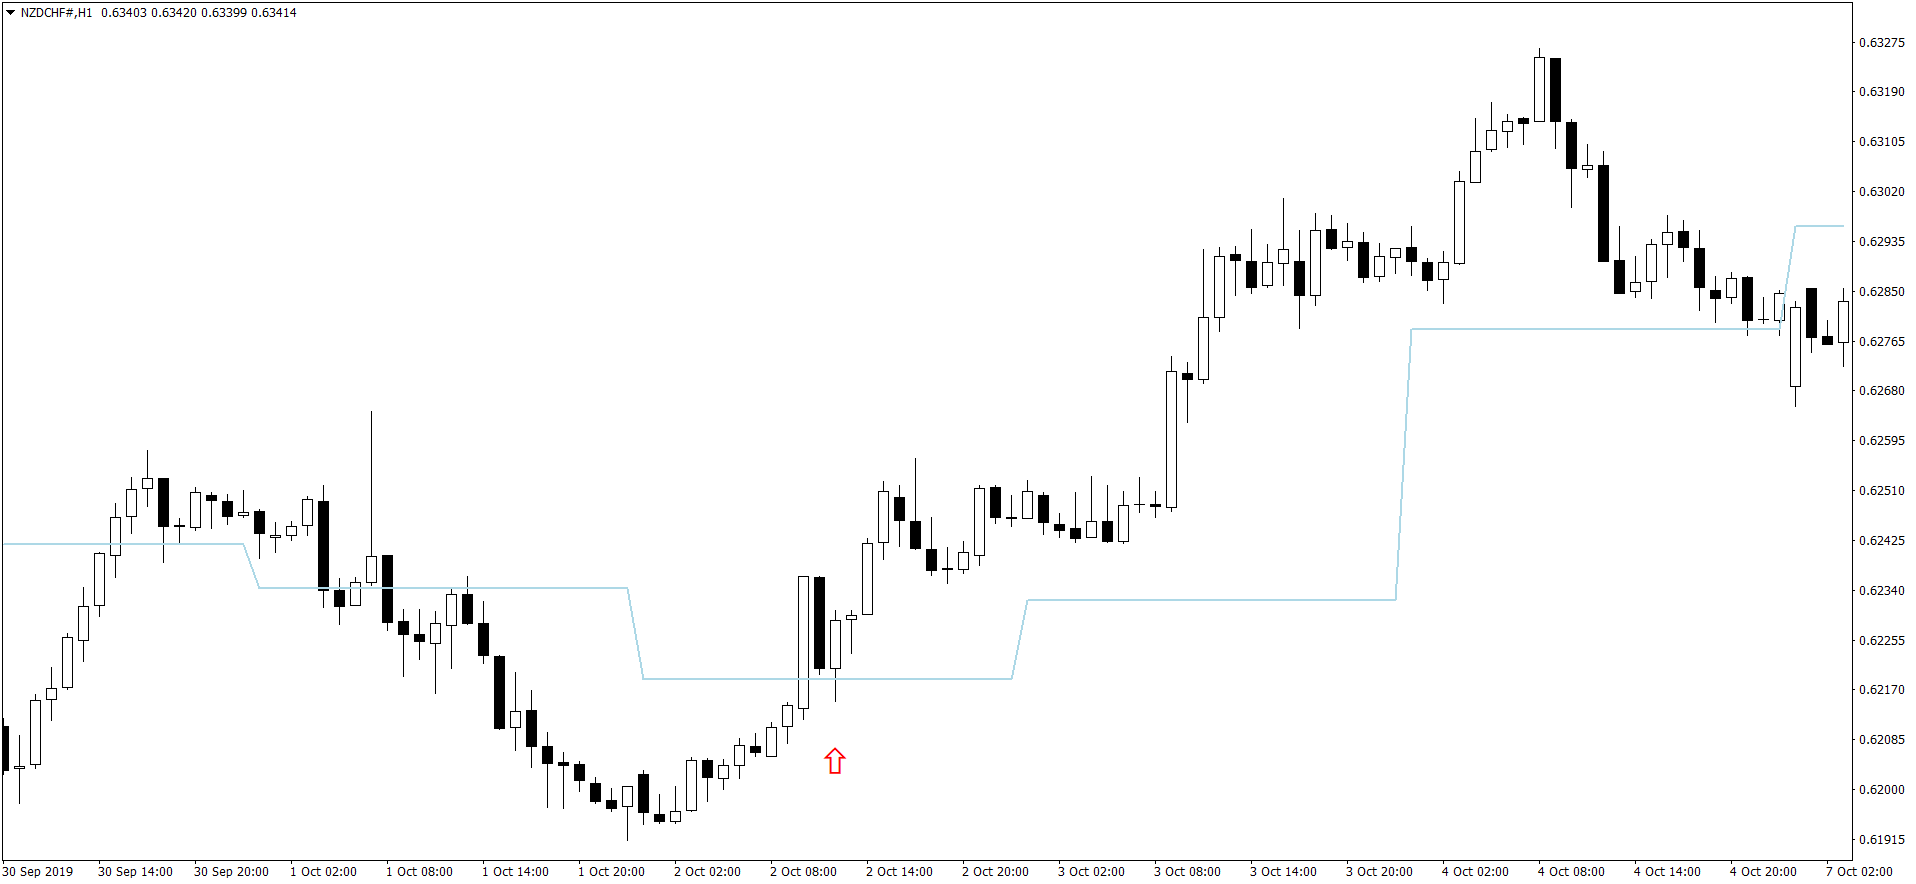
Above is NZDCHF long trade. When a candle is formed right on the daily pivot, it is a strong signal. I make the entry right above the red arrow. As you can see from the above chart, price moved more than 100 pips. So this is how I achieve my target of 100 pips with a small stop loss of 10 pips. Did I tell you I use neural networks or deep learning in my trading? Not at all. Forget about machine learning and artificial intelligence. You can use a very simple trading system like the one that I have given you now to make 50-100 pips daily. Just use it consistently. You will need a little practice in the beginning as you might try to open trades in exuberance that may not be good trades. But with practice of a few weeks, you will learn just by glancing at the chart whether you should take this trade or not.
I love to trade GBPUSD. GBPUSD is a highly volatile pair. It can give you many pips. You can lose a lot also when trading GBPUSD. It is moving up and suddenly you will find it moving down. GBPUSD can change direction pretty fast. How? Just keep this in mind. Financial markets now a days are pretty fickle and instantly change direction when there is some news. When President Trump speaks, USD pairs can go haywire. Of course this happens when he has something to say about the markets like trade war with China etc. If there is some news about Brexit, expect GBPUSD to go haywire. You will see it going up 200 pips in 2 hours and then suddenly dropping 200 pips in the next 2 hours. This is how the markets behave now a days. So we need a good filter that can help us choose our trades. Daily and Weekly pivot is one such filter. Above is a GBPUSD long trade. You can see price finding support at the pivot line. It is always a good idea to enter a profit target of 120 pips when trading GBPUSD right at the moment when you open the trade. GBPUSD moves fast and it is always a good idea to have the profit target in place. Maybe you don’t get the time to react quickly to GBPUSD movements. It can go up touch your profit target and then suddenly start dropping.
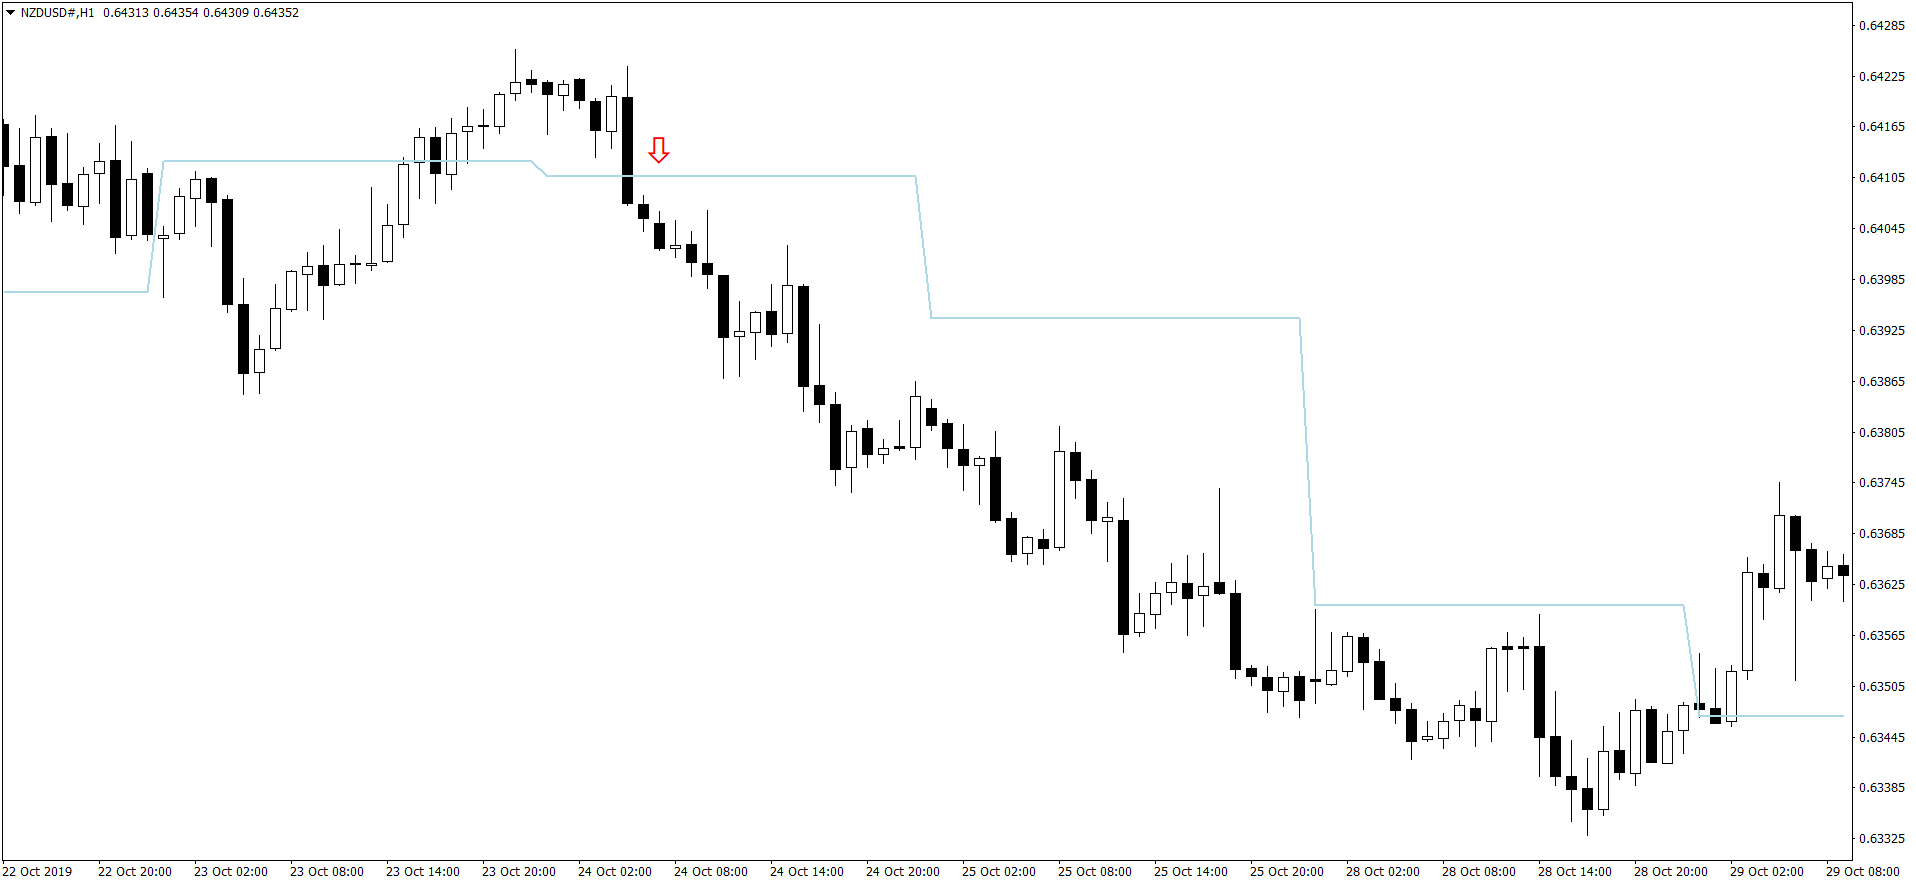
Above is NZDUSD sell trade. I love to trade NZDUSD. It can give very good low risk entries. Sometimes, it can clobber you also when you lose multiple trades with it. So always be careful. Just below the red arrow we make our entry and the trade make 100 pips in the next 3 days. NZDUSD is a slow moving pair unlike GBPUSD. It takes 2-3 days at least to make a 100 pip move. So when you have opened an NZDUSD trade, keep this in mind. Don’t be impatient. Let the price reach the profit target which can be 3-4 days as said above.
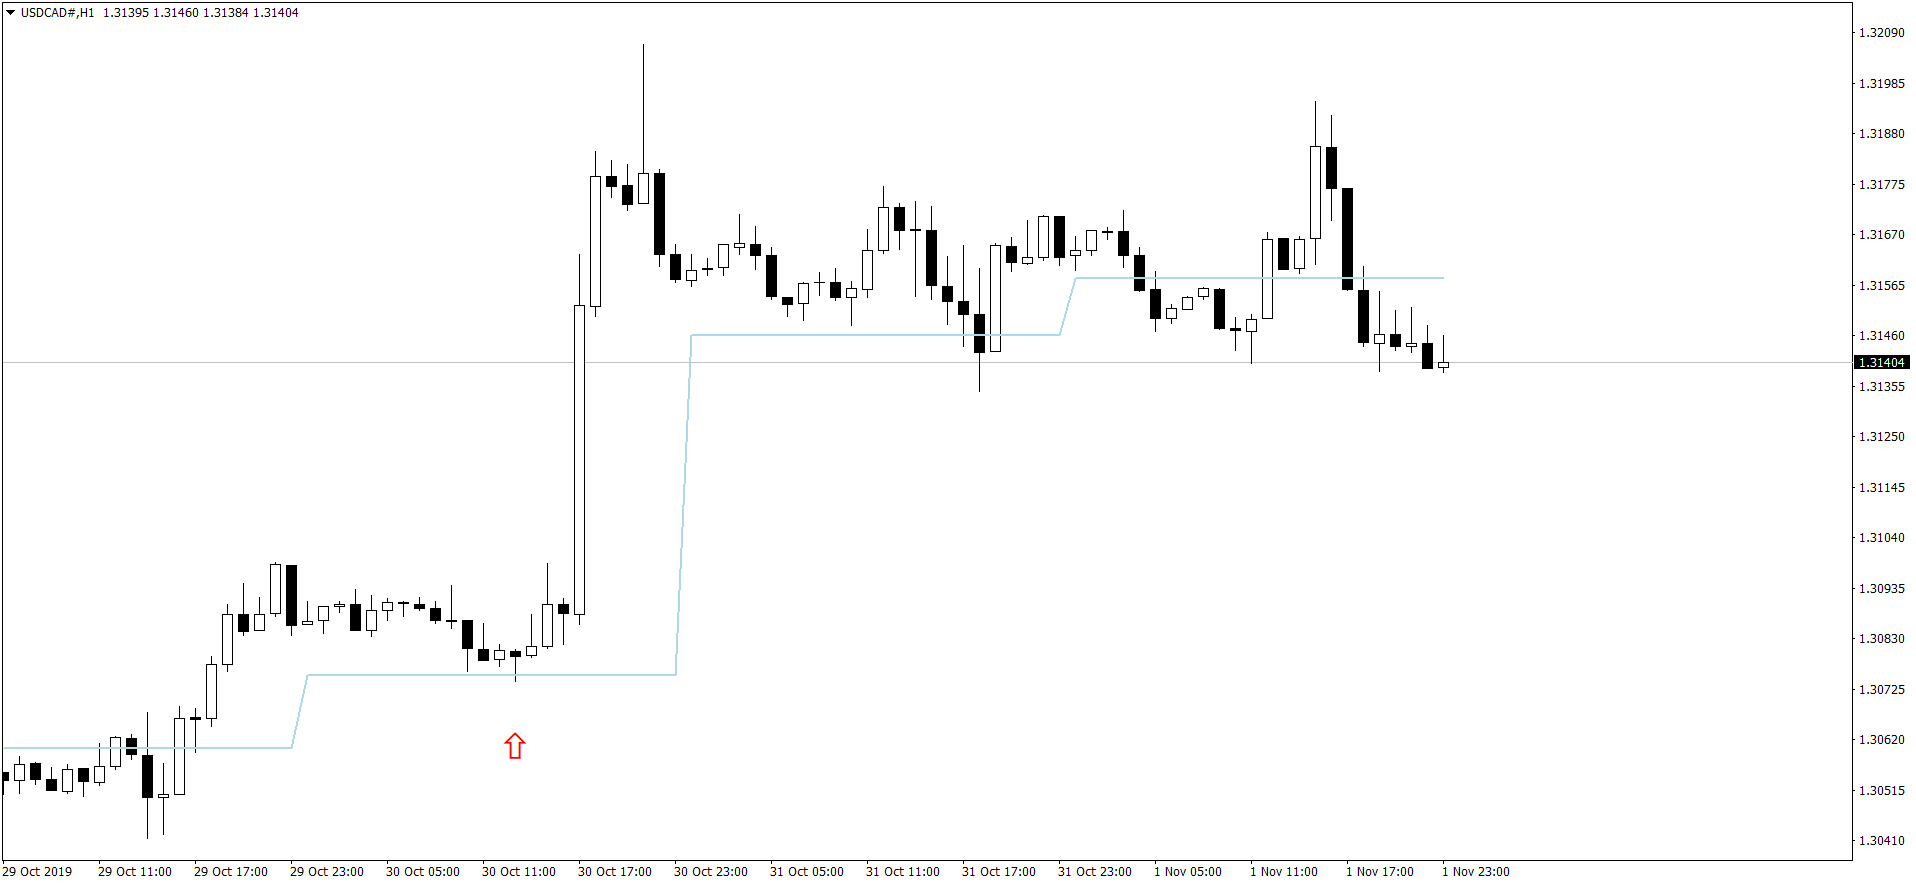
Above is a USDCAD buy trade. USDCAD can give you good trades. It can be highly volatile and erratic as well. Our weekly and daily pivot line filter helps us know when USDCAD plans to make 50-100 pips. You can see above we had a very low risk entry and we achieved our 100 pip target. 100 pips on USDCAD with 1 standard lot will be equal to $700. On GBPUSD and EURUSD it will be equal to $1000. Why? In USDCAD we have CAD as the quote currency. In GBPUSD and EURUSD, we have USD as the quote currency.
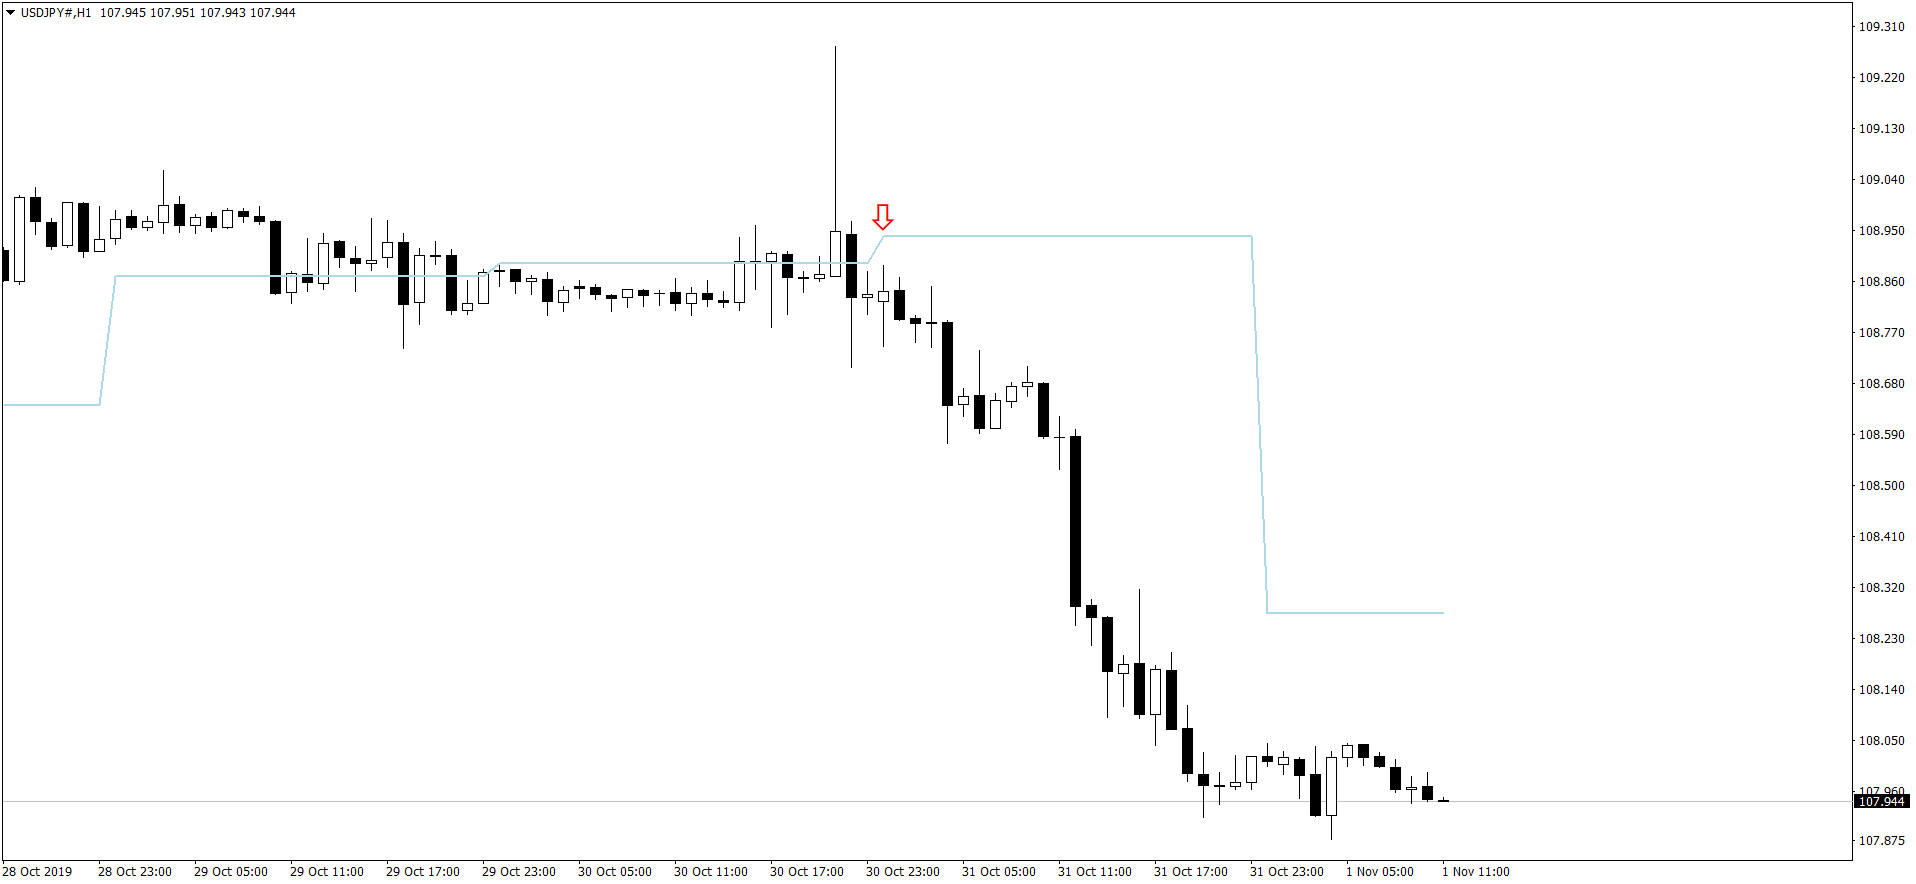
Above is a very important USDJPY long trade. As you can see above for many days, USDJPY just moved in a narrow range. There was no way to know which direction it will move. It appeared bearish. So I entered into a short trade and viola got the stop loss hit two times. Having lost 20 pips, I stopped trading USDJPY. Do you see the very big candle with a long wick on the upper side of the body? This candle was formed when FOMC Meeting minutes were released. Next day, when I looked at the charts, I saw the opportunity and entered into a USDJPY short trade just below the red arrow and make 100 pips. Having lost 20 pips, I made 80 pips in reality This is how I recover lost trades. I don’t rush into a trade. I try to make each trade 5 star. If I lose I don’t lose my nerve and wait patiently for a new opportunity. With patience you will also learn how to make 30-40% per week.
Why we see Price Patterns?
You might be wondering why we see price patterns especially after algorithmic trading bots having taken over the market. Price patterns get formed because so many traders open and close their trades. This includes algorithms also. So when millions of buy and sell orders are being made at every second in the market, this results into patterns that appear on the chart. We traders have our emotions and algorithms have their biases which result into price patterns.
Why we see support and resistance?
Why price jumps up when it reaches a certain price level? It can be due to a large buy order at that price level. A big company has to pay to its clients in UK. The company wants to buy $10 Billion of GBP and sell $10 Billion of USD. The order is placed by the company with its bank. Suppose the company wants to buy at 1.28700. So whenever price will reach 1.28700, bank will start buying GBP and selling USD. When the bank buys, price will jump as the order is big. So the bank stops buying when the price goes up and waits for the price to touch 1.28700. In the next few hours when the price again touches 1.28700, bank starts buying GBP and selling USD. This continues till the $10 Billion GBP buy order by the company is filled. It can take a few days. So you see why we see support and resistance at certain levels. Sometimes, there can be a big options order being placed at a certain price level which acts as a support/resistance level.
Now that you have gone through the post, I want to make it clear. Forex trading needs practice. You wont succeed in a few weeks. It can be a few months and even a few years. I took more than 5 years to succeed. So I want you to keep this in your mind. Start small with a small account something like $100. First double it. If you cannot trade a small account, you wont be able to handle a big account. There will be too much emotions involved when you will see your hard earned money at stake. Especially after losing a few trades, you will be a mental wreck and you will start placing revenge trades in an attempt to recoup the loss. The more trades you will place, the more you will lose. So take it easy. Start small. Practice and in a few months or may a few years like me you will also succeed. Good Luck!